
Tis the season for matchmaking and modeling! With Valentine’s Day upon us, we often find ourselves strategizing how to best sweep that special someone off their feet or effectively woo a potential new love interest. When it comes to predicting consumer engagement, identifying our best customers , and performing churn analysis, we turn to the power of data science and machine learning to uncover patterns and answers we have trouble concluding ourselves. What better way to improve our chance at romance than a data-driven exercise in predictive analytics
Our Dating Dataset
To analyze the influential factors in receiving that coveted call back, we’ll dive into a dataset detailing match and questionnaire information gathered during a speed-dating experiment, publicly available on data.world. Participants provided information on their career field, dating patterns, goals for the evening, interests, and expectations. The questionnaire results also include information on five different qualities:
- Attractiveness
- Sincerity
- Intelligence
- Fun
- Ambition
Each participant recorded their perception of these qualities within themselves, as well as the perceived importance of these qualities to others. After each 4-minute match, partners recorded if they would like to go out a second time with their date. Let’s see if we can predict which matches were made in heaven.
Getting started in Azure Machine Learning Service Designer
We’ll explore our dataset and create a model to predict the partner’s decision to keep the spark alive with Azure Machine Learning Service Designer. Designer presents a nifty drag-and-drop interface to easily import data, perform cleaning and transformations, and build machine learning models, while integrating with Azure Machine Learning Service’s capabilities, like dataset and model registry, as well as its scalability and security.
Grab some chocolates and pop a mint. Let’s start modeling!
First, we can drag an Import Data module onto our canvas to access our dataset and use a Select Columns in Dataset to pull in the questionnaire responses of interest to our analysis. After running our experiment, we can navigate to the Outputs tab of the module to visualize our dataset.
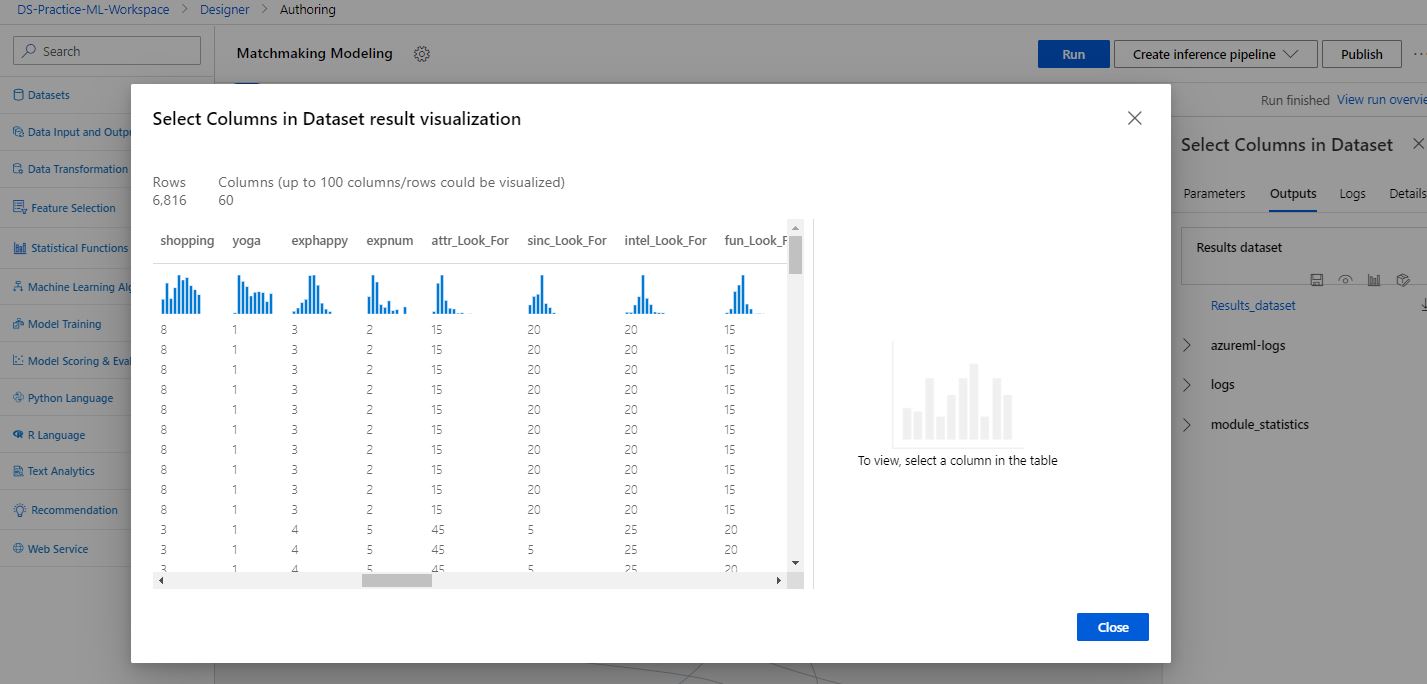 Here, we can see some of the potentially predictive information provided by participants in their questionnaires, like interest level in different activities such as shopping and yoga, expected happiness and number of interested partners from the event, and importance of sincerity, intelligence, and fun in a potential match.
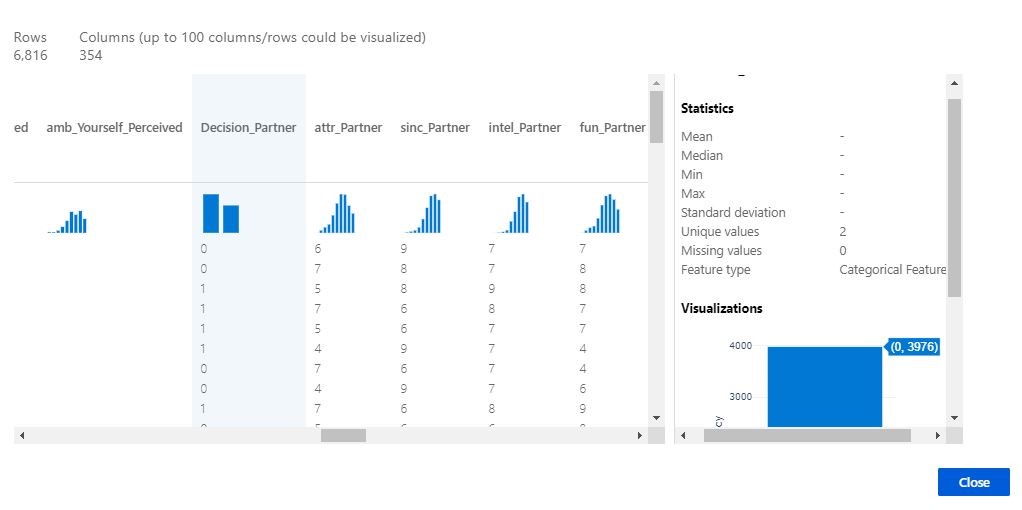 After adding an Edit Metadata step to make sure our columns representing categories are coded as such, we can also check out our target column for predictive modeling. Decision_Partner represents a yes (coded as a 1) or no (coded as a 0) to a second date for each partner encountered in the speed dating experiment. It looks like about 60% of the time, partners decide to snuff the flame and decline a second outing. Maybe we can help improve the chances for these singles!
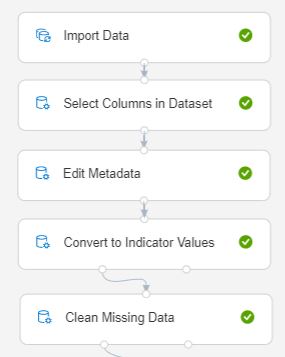 Next, we’ll perform a data processing step common in machine learning- converting our categorical columns to indicator, or “dummy” columns. Machine learning algorithms can only process and understand numbers, so a column reflecting a category, like undergrad university attended, doesn’t have any use to a model in a wordy format. We can encode these columns as numeric values by creating columns reflecting each category, like a column for Harvard and a column for Yale and representing if the person in each row belongs to that category with a 1, or not with a 0. We’ll also remove rows reflecting incomplete surveys.
Training the Matchmaking Model
Now that our dataset has been prepared for modeling, we can split our dataset into two groups of rows. One set of rows will be used to teach our model the patterns in our data and determine how to best manipulate the information available in each row to predict if Decision_Partner is Yes or No. The other, smaller, set of rows is withheld from this training process and is used to determine how well our model does at predicting. Testing our model on data it hasn’t encountered before helps simulate a real-life situation in which the model is applied to data without knowledge of the predicted column, and ensures our model will be generalizable. Typically, 80% of available data is used for training and 20% for testing, but this ratio can vary from case to case.
We’ll then feed our training dataset into a Train Model module as well as a Two-Class Support Vector Machine algorithm. This algorithm performs complex transformations on our data (so we don’t have to) and locates an optimal divide in our data to best separate the two values of our target column, yes or no to a second date.
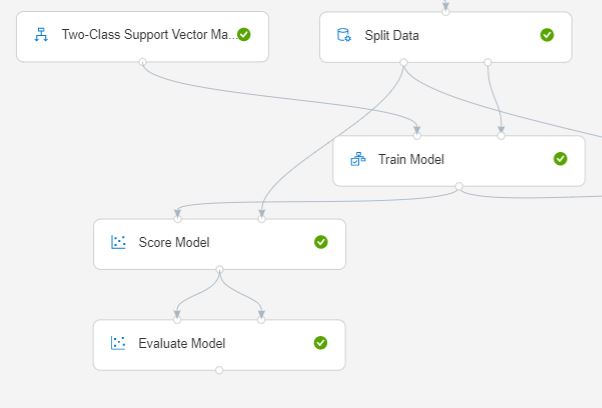
From there, we’ll use the trained model to generate yes/no predictions for our testing dataset in the Score Model module. We can then evaluate the performance of our model by calculating the accuracy of predictions made, given the partner’s actual decision and if the model predicted yes or no correctly.
Our Results
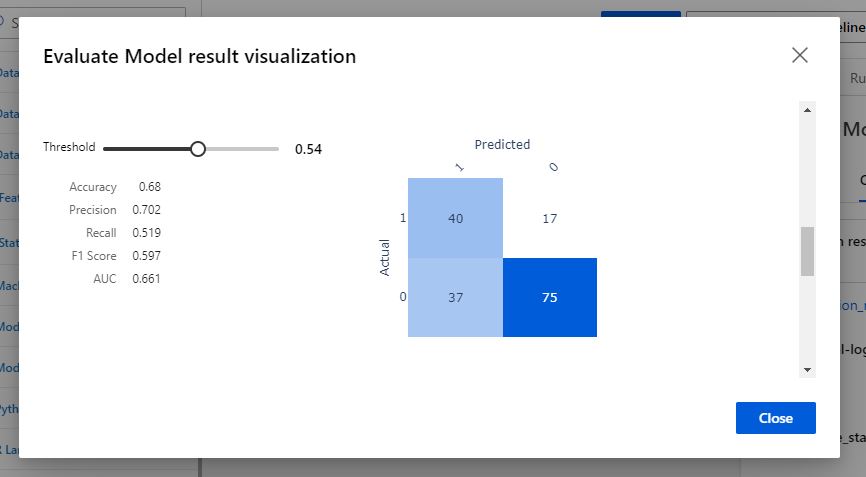
In visualizing the Evaluate Model output, we can see that our model can predict if a partner will decision yes or no to a second date with about 70% accuracy. Not too shabby!
 We can dig deeper into how our model makes predictions by fitting different permutations of our model, one for each predictive column. Column by column, values are randomly shuffled so that the column no longer has any predictive value, and the accuracy of the model is measured before and after. If the model suffers from the loss of this predictive column, we can gather that the feature is an important part of how the model makes its predictions.
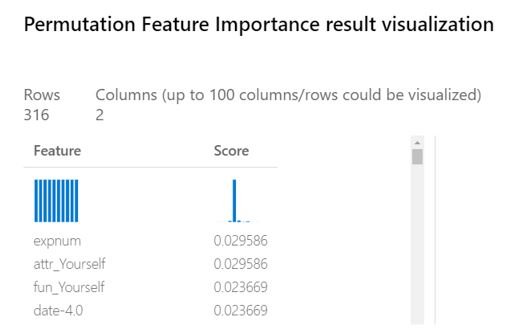
Overall, it seems like self-confidence is a strong driver in our model’s positive predictions, and a positive speed dating experience. Our output lists the response to the question “Out of the 20 people you will meet, how many do you expect will be interested in dating you?” and how attractive participants rated themselves as the two most valuable features for predicting if a partner will decide yes to a second date. These features are closely followed by how fun participants rated themselves, and a response of “Twice a month” to “How frequently do you typically go out on dates?”. Given this analysis, maybe we can conclude that the key to alluring your sweetheart this Valentine’s Day is simply believing in your charisma.
Whether we’re forecasting our monthly sales, identifying patterns in our customer base, or attempting to revolutionize the dating game, data science is there to augment our strategies and decision-making processes. If you’d like to discover how to apply machine learning to predict patterns, trends and outcomes in your business, get started with Data Science in your organization today.


