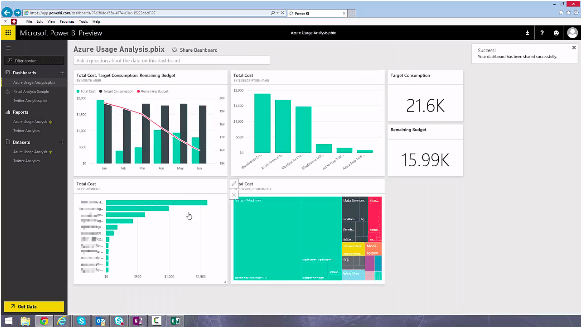
Microsoft Power BI with the new Power BI Designer makes it easy to combine data from multiple files into an easy to analyze data model. When published to http://powerbi.com, you can share an interactive dashboard with as many people in your organization as necessary.
In today’s Demo Day video, I’ll show you how I combine monthly usage data that I receive from Azure into a single analysis application, build a dashboard, and then share it with my team.
In addition, you’ll see how you can:
- Combine, clean and shape data with the Query designer for Power BI
- Build interactive, drag-and-drop charts
- Use custom calculations to enhance your data
3Cloud offers hands-on, instructor-led training at your facility to help both business and IT teams adopt Microsoft Power BI for self-service business intelligence and analytics. Up to ten attendees will receive expert-led guidance through a complete set of hands-on labs and training modules. After the training, attendees will be able to acquire data, build data models, and create visualizations quickly and easily with Microsoft Power BI.


