
With Microsoft once again ranked as a Leader in the Gartner Magic Quadrant, it’s important to recognize the evolution of the business intelligence market and likely future direction of BI. Over the past few years, BI and analytics vendors like Microsoft have moved well beyond the concepts of descriptive analytics by extending “self-service”, broadening focus beyond data visualization and reporting, and more. So, what’s new and what’s changed?

Gartner 2021 Analytics and Business Intelligence Criteria
In 2021, Gartner evaluated Analytics and Business Intelligence platforms around twelve areas that it defines as critical capabilities:
- Security
- Manageability
- Cloud Analytics
- Data Source Connectivity
- Data Preparation
- Catalog
- Automated Insights
- Data Visualization
- Data Storytelling
- Natural Language Query (NLQ)
- Natural Language Generation (NLG)
- Reporting
To see Gartner’s commentary on how Microsoft and other vendors faired when measured in these areas, you should read the report directly from Gartner. It’s clear that in Gartner’s estimation, Microsoft once again found the right balance of features in Power BI and its surrounding ecosystem to rank highest in both Ability to Execute and Completeness of Vision.
What made Microsoft stand out from the pack of competitors again this year? Let’s focus on a few advantages.
Augmented Analytics
More visibly than many other vendors, Microsoft has placed strong emphasis on bringing AI to BI. By blending artificial intelligence capabilities into Power BI, Microsoft has a garnered a high rating in Gartner’s view. This is seen most notably in natural language query and natural language generation, but there are also other ways that Microsoft has infused AI into Power BI over time.
In fact, augmented analytics are not a new focus for Power BI. Even at its launch in 2015, natural language Q&A existed in dashboards in the Power BI Service. The capability that allowed a user to type a sentence and then automatically built a chart was revolutionary at the time, but now it is common. The growth in Power BI’s native or integrated AI features has grown immeasurably since. Features such as Quick Insights, AI Insights (using Cognitive Services), Auto ML, and are built into Power BI. In addition, many AI features are available in visuals directly for creators such as Q&A, Key Influencers, Decomposition Tree, and Smart Narrative.
With these AI-infused features brought to Power BI, it shows the enrichment of BI that goes well beyond the concepts of simple reports and dashboards. Users and content creators have capabilities to speed up time to value, often by helping users surface insights that they may not have considered before or that would have taken more time to develop.
Feature Highlight: Smart Narrative
In a single example highlighting natural language generation, let’s take a look at how Power BI’s Smart Narrative augments BI with AI. As features like these get refined by Microsoft and other vendors over the next few years, this is a promising area to monitor.
As a simple example, what can Power BI’s Smart Narrative generate when it comes to the Pfizer-BioNTech COVID-19 vaccine distribution in the United States?
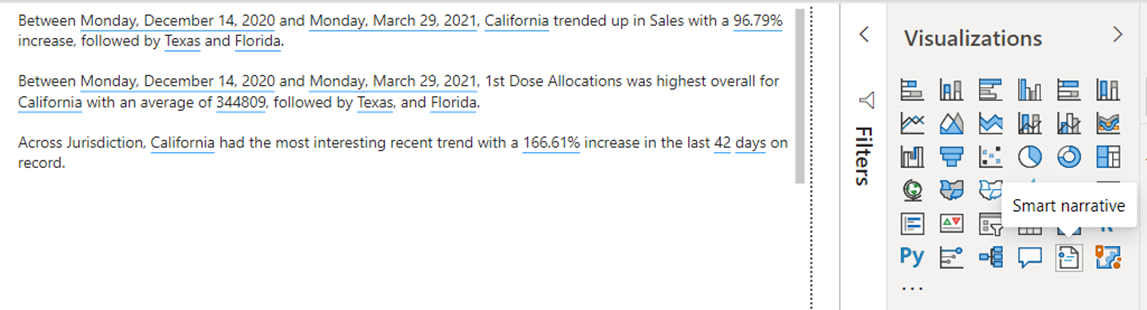
(Source: https://data.cdc.gov/Vaccinations/COVID-19-Vaccine-Distribution-Allocations-by-Juris/saz5-9hgg Accessed: March 27, 2021)
With only a few simple data points, Power BI wrote a narrative about recent vaccine distribution. While it’s not the text that I would have likely written or all the insights I specifically would have chosen to highlight, the point is that it’s generated automatically.
Feature Highlight: Create Report
Extending the example from a single visual, what about taking a dataset and automatically creating a report? Power BI recently introduced a preview feature that automatically generates simple reports. When Gartner describes augmented consumers, empowering end users with features like this one comes to mind. Again, it’s not the layout that I would have authored, but that’s the essence of the feature. The idea is that Power BI gives even consumers (and not simply analysts) tools for surfacing insights with quick, basic analysis of a dataset.

(Source: https://data.cdc.gov/Vaccinations/COVID-19-Vaccine-Distribution-Allocations-by-Juris/saz5-9hgg Accessed: March 27, 2021)
With next to no work or time, you have a starting point for insights that Power BI authored automatically, and report creators can continue to enhance and refine from there. While they’re still rough, it’s exciting to think of the state that features like these will be at over the course of a few more years.
Ecosystem Advantages
It’s become clear that while Power BI is a standalone product, it’s truly more powerful when viewed alongside the wider Microsoft Office, Microsoft Teams, Power Platform, and Azure ecosystems.
Where other vendors have often acquired and been acquired to quickly enhance offerings, Microsoft has been able to lean internally to add or integrate features. For example, in order to solidify its own position as a leader in this magic quadrant a few years ago, Tableau acquired Empirical Systems to help launch what eventually became its natural language features Ask Data and Explain Data. In turn, Salesforce later acquired Tableau and eventually blended its own Einstein Analytics into Tableau. On the other hand, Microsoft is unique because the balance of critical capabilities so far have been able to come internally. These capabilities often come in both native features and through integrations with other best-in-class Microsoft products.
Microsoft has been able to enhance Power BI by integrating with its own products instead of being more vulnerable to consolidation and change like other vendors. For example, Power BI can have enhanced data protection and security through Microsoft Information Protection and Cloud App Security. Azure Purview now integrates with Power BI for governance. Users can utilize their own Azure Machine Learning models through Power BI. Cloud analytics blending Azure Data Lake, Synapse Analytics, Power BI, and more helps organizations establish a truly modern data platform. These examples are not comprehensive, and there’s a lot more you can do if you’re willing to use Power BI alongside Office, Azure, and the Power Platform.
These explicit product integrations typically come with additional cost, but there are also a range of native capabilities that take advantage of the Microsoft ecosystem under the hood without having to purchase additional licenses outside of Power BI. Features such as Auto ML with Power BI Premium, natural language generation with Smart Narrative, dataflow storage that’s really Azure Data Lake, Power BI Premium Gen2, and more are all built directly into Power BI.
With these advantages for Microsoft Power BI combined with a low price point for per user licensing, it’s difficult for others to compete. Even if Power BI isn’t the best among vendors in a single area, such as data visualization—which Gartner now says is commoditized in its report this year—the ability to leverage the ecosystem makes it widely attractive across all capabilities that organizations might choose to evaluate.
Cloud-Scale Analytics
Leveraging the ecosystem while still keeping the label of Power BI was perhaps most visibly seen this past year in Power BI Premium Gen2 and the new $20 per month Premium Per User licensing. Without even considering direct integration with highly scalable compute using Azure Synapse Analytics and other Azure offerings, what can you get with Premium packaged only in Power BI?
Until this past year, Power BI Premium was a capacity-based offering with a defined set of resources. That’s changed with Premium Gen2. Premium now includes greater flexibility with features such as autoscale, where capacity can grow temporarily if additional resources are needed. This brings Power BI more in line with more flexible and scalable compute offerings already available in Azure. There are also advantages in Premium Gen2 around performance, where Microsoft claims up to 16x better performance could be achieved. There are also no longer any restrictions on refresh concurrency, memory limits, and more that had an impact when balancing many different workloads in a single capacity.
Also, instead of having only capacity-based pricing, the new Premium Per User (PPU) licensing allows small to midsize businesses a much more realistic and cost-effective way to use Premium features. For $20 per user per month (Pro is $10 per user per month by comparison), users can take advantage of almost all Premium features with only a few exceptions, such as multi-geo capabilities.
3cloud Aligns with the Magic Quadrant Leader
3Cloud recognized the strength of the Microsoft data platform in Azure and also decided to go “all in” on Power BI for modern business intelligence a few years ago. Across our company, in many different industries and verticals, we’ve designed and built solutions with modern, cloud-driven technologies. We evangelize appropriate tools throughout the Microsoft ecosystem and try not to think of Power BI in a vacuum. If you’re interested in learning more about how we’ve brought value to organizations through Azure and Power BI, check out our solution briefs and contact us today to find out how we can help you!


