

Also known as Sensitivity Analysis, what-if analysis is a business technique used to determine how an actual or projected measure is affected by changes in the assumptions upon which that measure is calculated. What-if analysis is often used to compare different scenarios and their potential outcomes based on changing conditions.
What-if analysis is applicable to virtually any activity or system in any industry. For example, if you’re planning on implementing an information system for a specific purpose at your company, you might consider the cost of buying an off-the-shelf product versus developing it in house. However, what if the cost of developer hours goes up between now and then? What if competition heats up between software vendors? These factors could affect your costs and your ultimate decision. Other applications for what-if analysis include profitability analysis in commerce, hazard analysis in finance, promotion analysis in marketing, and effectiveness analysis in production planning.
By conducting a what-if analysis, you can explore various plausible scenarios and make better decisions as a result. Not only can you make better and more informed decisions by changing assumptions and observing or estimating the results, you are also better able to do it faster and with less risks.
The ability to perform a what-if analysis is an important feature of any BI tool and the August release of Power BI introduces this ability. Let’s take a look at an example of how to set up a simple what-if analysis in Power BI Desktop.
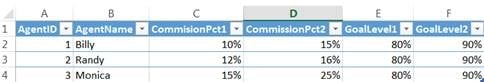
We’ll use a data set containing sales by agent over a period of time. Each agent has a commission structure based on percentage of sales goal achieved. For instance, my contract with agent Billy stipulates that his commission will be 12% if he reaches 80% of the sales target, and 16% if 90% of his target is met, respectively. We want to look at various target values to evaluate Billy’s earning potential for a month.
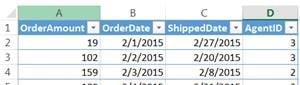
We’ll use a simple excel file as source. The sales tab has the structure below:
Our agent/commission table could look like this:
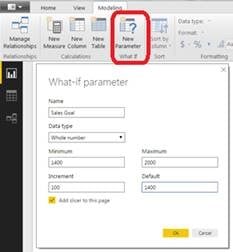
After importing this source into Power BI, we can create a simple dashboard allowing us to filter by sales agent and see the sales performance of each one of our agents by month. You will notice that we do not have an actual sales goal or target yet. We will supply one using the new What If parameter in power BI. Let’s do that next. From the Modeling Menu, select New Parameter like in the capture below. Enter a name, as well as minimum and maximum values for the parameter.
We can now use the new parameter in various DAX expressions. To calculate the sales agent commission, we will have to compare their monthly sales performance against the two thresholds we defined in the data and then multiply their sales by the corresponding commission percentage. The formula will look something like below:
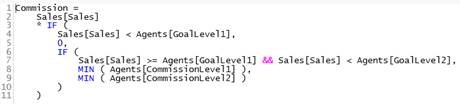
The GoalLevel1 and 2 above are defined as GoalLevel1 = ‘Sales Goal'[Sales Goal Value] * MIN(Agents[GoalPercentage1]), where Sales Goal Value is the What If parameter we defined earlier. The simple sales dashboard could like the capture below, showing Randy’s sales performance for the month of July. Note that we are using a bullet chart (by OKViz) to visually represent performance against targets. Watch how the Goal Levels and the Commission value change as we modify the value of the Sales Goal. In essence, we are answering the following question: what if I set the Sales goal to $1,600, how will that affect my commission potential?
In conclusion, what-if analysis can be a quick way to evaluate various scenarios based on one or more input parameters and Power BI makes it extremely easy to implement this type of analysis with functionality from the August 2017 release. To see it in action and download a copy of the PBIX file, please visit the What If contest page on the Microsoft Data Stories Gallery here.
To learn more about Power BI, check out our webinar on Advanced Data Modeling. To learn more on how to implement Power BI into your organization contact us today.
Editor’s Note: The post was originally published in [May, 2019] and has been updated for freshness, accuracy and comprehensiveness.


