
Mastering when to use a calculated column versus when to use a measure – a concept that is often misunderstood when working with Data Analysis Expressions (DAX) in Power BI – is key to reporting success. Choosing the wrong one can result in anything from poor report performance to incorrect results.
By understanding how both calculated columns and measures are evaluated, the instances in which we would use one or the other, and by structuring your code to take advantage of the strengths of the DAX language, you will be able achieve faster reporting and (if your code is appropriate for the scenario) more accurate results.

In general, we use calculated columns and measures to perform arithmetic operations on top of the data that we already have in our model. A simple example could be having a sales table with a Unit Price column and an Order Quantity column, and the desire to know the Order Total for each line, or in aggregate. Let’s work through some common business scenarios with the following Power BI file, available here.
Understanding Calculated Columns
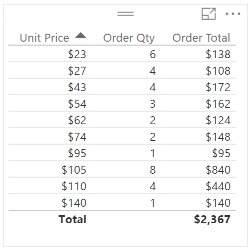 Figure 1
When trying to get a grasp on calculated columns, it is essential to know why evaluation context is significant. Evaluation context is the “environment” under which the formula is evaluated. Although calculated columns can compute aggregate values, the evaluation context is performed by default for each row, which suits calculated columns for some computations, but not others. In the example above (Figure 1), if we would like to know the Order Total for each line, which could represent an individual order from a customer, it would be appropriate to use a row-by-row calculation, which would make a calculated column a good choice. The DAX expression for the calculated column would look like this:
Order Total =
'Sales'[Unit Price] * 'Sales'[Order Qty]
With calculated columns, data in the column is stored in the xVelocity in-memory database, meaning that a calculation is made before the model is ever queried by the user. From a performance perspective, calculated columns are positive given that there is a smaller virtual memory requirement as the user interacts with the report. The downside is that calculated columns take up more storage in your database. Calculated columns can give users other advantages as well, such as the ability to view values in the column, or use of the calculated column in a slicer or in a measure to filter data under certain criteria.
Let’s say we want to use our Sales table (in the provided sample file) to classify items as low, medium, or high priced (Figure 2). We can use the following DAX expression in a calculated column to accomplish this, which will give us the ability to add a slicer and see only the category that we are interested in, as shown below:
Cost Bucket =
IF (
'Sales'[Unit Price] < 50,
"Low",
IF ( 'Sales'[Unit Price] < 100, "Medium", "High" )
)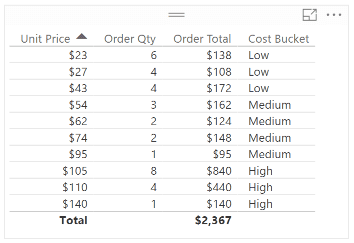 Figure 2
Here is an example with the “High” Cost Bucket calculated column slicer selected:
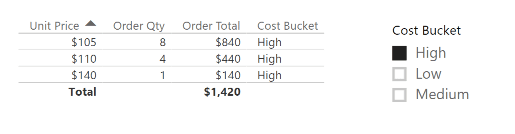 Figure 3
Interpreting Measures
In general, measures are used to calculate aggregates, such as the sum or average of a column. Measures are calculated at the time of your query, which means that they aren’t stored in your database, but use processing power to execute a query at the time of your request. Because measures are not stored in memory, they are generally faster, although it is important to recognize the tradeoff between utilizing in-memory storage or processing power in an instance where either a measure or a calculated column could be used.
Continuing with the example above, a DAX expression where it would be appropriate to use a measure could be an instance of when you want to calculate the sales for all of your high-priced inventory (Figure 4). Note that we are using a calculated column, Cost Bucket, within this measure. In DAX, it is considered best practice to “reuse” metrics in this manner. If you were to redefine what you would consider low, medium, and high-priced, these changes would carry through to this measure. For this measure, the expression would look like this:
Sum of High Orders =
CALCULATE ( SUM ( 'Sales'[Order Total] ), 'Sales'[Cost Bucket] = "High" )
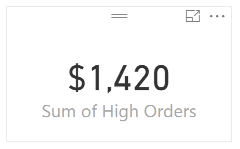
Figure 4
It is also useful to know how measures are evaluated in Power BI. Let’s break down the steps using the example above:
- Examine the evaluation context. In the example above (Figure 2), the DAX engine is selecting high-priced inventory, or where ‘Sales'[Cost Bucket]=”High”.
- Apply the evaluation context to the underlying table. In the example above (Figure 3), this means that Power BI is filtering ‘Sales'[Order Total] only for high-priced inventory.
- Perform the aggregate operation. In the example above, this means that we are summing the Order Total, or SUM(‘Sales'[Order Total]).
- Return results. As we can see above, the measure, Sum of High Orders (Figure 4), matches the results when we total the rows of the calculated column, Order Total (Figure 3), in the table.
Although there are additional technical and performance considerations for when to use a calculated column and when to use a measure, the high-level differentiation between the two are:
- Use a calculated column when you want to evaluate each row
- Use a measure when you need an aggregate
If you are interested in learning more about measures or calculated columns, be sure to check out Microsoft’s Power BI Documentation. Additionally, if you have a question or want to know more about how 3Cloud can help your organization with Power BI, contact us!


