The team at 3Cloud often talks about data and analytics strategy, but to me they do so much more, which is why I accepted the invitation to do a guest blog on strategic analytics and BI. I am very appreciative of the opportunity.
First, let me explain the difference between the two. In general terms, Strategic Analytics/BI implies more of a strategic role aro
Take a look at human resource management as an example. This discipline went through a similar curve when “strategic human resource management” gained a position in the C-suite, and the head of HR was elevated to be the second or third most important position in the organization. (Welch et al., 2005). I see the same trend now happening in analytics/BI.
What does this mean?
It means the integration of analytics/BI into an organization will provide a competitive advantage, while separating the high performing and low performing companies.
What does this involve?
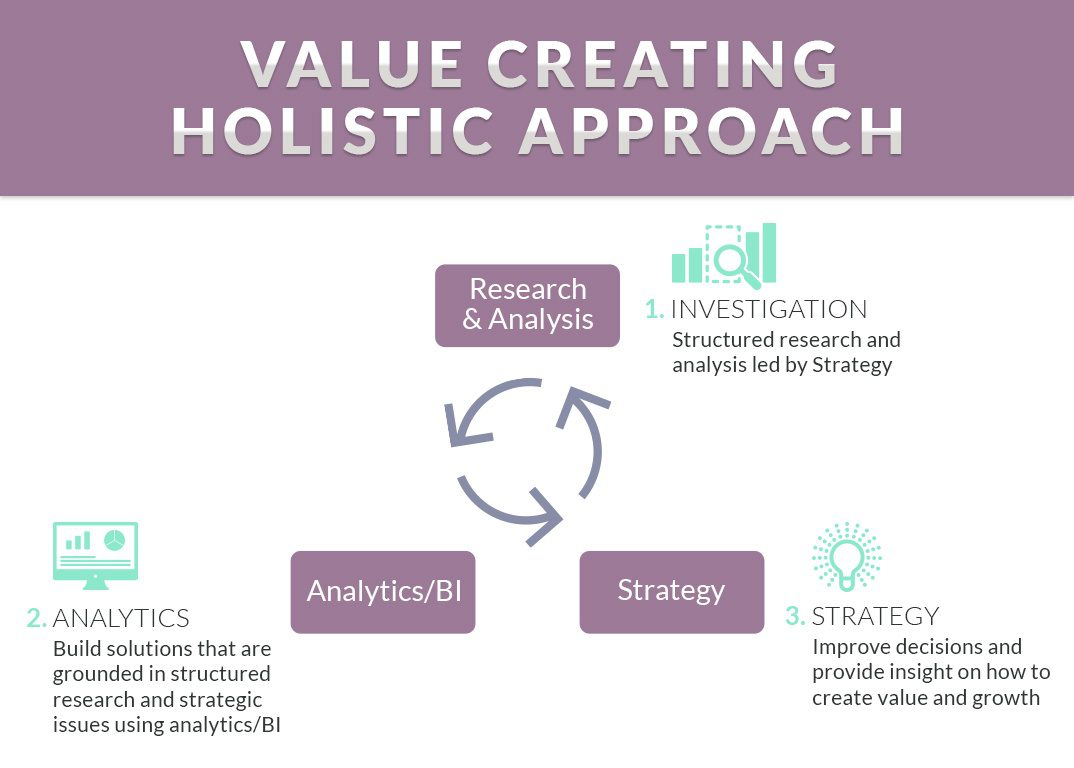
Strategic Analytics/BI requires more of an in-depth approach for data driven organizations, and the data supported decision making that ultimately drives organizational efficiency and effectiveness. This requires a holistic approach with three main functions designed to reinforce and support each other like a three legged stool:
- Strategy
- Research and Analysis
- BI/ Analytics
Let’s look at each of these and show how they act as three reinforcing and supporting legs of a stool, and what it means for the integration of strategic analytics/BI into an organization.
I should also note I am not the first person to think data projects or data scientists should have many important characteristics.
Strategy
The term Strategic Analytics/BI implies decisions are made, resources are invested, and plans for data and analytics are created based on the needs and critical questions a business is facing. The need for analytical solutions in today’s business environment is crucial because they allow users to think strategically about how an organization builds its core competencies and creates value. This not only informs the entire process, saves a lot of time, effort and money, but also leads to value creation.
Simply put, strategy means extensive business (or topic) acumen should lead the way. This is in line with Bernard Marr’s (2015) book on using smart data. In the book, Bernard uses the idea of smart data over big data and came up with the 90/10 rule for data and analytics. This rule suggests when working with data, 90 percent of your time should be spent on a structured strategic approach, while 10 percent of your time should be spent on actual data and analytics. This may seem backwards, but many dashboards and data projects have been created and undertaken that simply waste time and leave organizations spinning their tires with uninformative data and unused dashboards that lead to poor decision making. Having too many assumptions can lead a project down the wrong path very quickly.
As we know from previous blogs from the 3Cloud team, key analytical solutions that end up being partially or completely dropped by the business, are partial or complete failures regardless of how sophisticated their engineering underpinnings. The value of data and analytics projects should be driven by how they inform your pressing business issues and how they can illuminate important business issues, not the amount of data or level of sophistication of the solution.
Research and Analysis
The second leg of the stool involves structured research and analysis. Structured doesn’t mean reduce the creativity and innovation in the process, but rather guide the process with research structure. Again, uniformed exploration and creativity can be extremely wasteful and time consuming for everyone. In general, this means effective research design including the required due diligence towards both measurement and statistical analysis. Poor attention to measurement seems to be the culprit in many failed or overzealous analytical endeavors.
Effective research and analysis starts with good measurement, which creates valuable data. Good strategic measurement is often referred to as the dirty work of data science. It requires a focus on good measurement techniques and accurate collection and cleaning of the data necessary to glean insights from it.
One bad measure can proliferate through the data and then adversely impact all decisions. This requires all analytical undertakings to emphasize and heighten the focus on two major measurement issues: validity (all types) and reliability (Kerlinger & Lee, 2000).
Validity refers to what we are measuring. For example, failed projects often tend to have a measure (e.g., shot attempts in hockey data), and extrapolate that measure to mean something else (e.g., that shot attempts mean possession in hockey). Many productivity measures in business fall in this domain. This can be dangerous, to say the least.
Reliability refers to how precise the measurement technique is. For example, how precise is a survey instrument at measuring something of interest that we are basing our business decisions on (engagement survey anyone)?
After validity and reliability concerns have been addressed, it’s necessary to shift back to strategy for an important reason: Not everything that counts can be counted, and not everything that can be counted counts (Einstein and/or this book (Cameron, 1963). To show in a similar way how strategy impacts measurement, we can look at how Rasmussen and Ulrich (2015) started a recent article on HR analytics with this cite by famous mathematician John W. Tukey:
Far better an approximate answer to the right question, which is often vague, than an exact answer to the wrong question, which can always be made precise. John W. Tukey, mathematician, 1962
In addition to measurement, the research and analysis leg includes the development and use of statistical models. This is essential because different data requires different types of models. A review of previous findings is a critical first step as new models aren’t always better, and it is often unnecessary to reinvent the wheel. After all, most things have been done already and require easy solutions. That is, effective research and analysis combines the extensive business/topic acumen (i.e., linked with strategy) with a deep research and statistics background allowing appropriate selection and development of data collection and analysis procedures. In his sports analytics book, written as a guide for coaches and managers, Benjamin Alamar (2013) suggests the need for someone with a PhD in a specific field that has the adequate training to conduct the research. But a PhD is no longer the only option as data science programs and training seminars are focusing on many of these aspects. In reality, a team with a deep bench of professionals that has experienced (and experiences) many of these issues day in and day out in various contexts is probably the ideal solution
BI and Analytics
The final leg that brings everything together is BI and analytics. This involves actually pushing through all the hard work to get to usable (i.e., decision makers understand it) and informative (i.e., helps with decisions and strategic insight) output. This is the technology driven side of the analytics, and where the platform, hacking and deployment solution decisions are made. This includes actual development and deployment of tools throughout the organization and building of the data and analytics strategy. After all, strategy and architecture are the pillars of an analytics program.
BI and analytics requires an extensive knowledge and understanding of how strategic and other organizational decisions are made, and how this can be improved to support growth and value creation in a company.
Different solutions and data strategies support different decision structures. Strategic analytics/BI solutions can be extremely empowering for employees, and create value by informing decision making if it fits the structure. It can be equally as dangerous if there is a misfit between company strategy and data strategy.
Final thoughts
To maximize value for the organization, strategic analytics/BI must be the norm, and organizations must integrate it so they can do strategy, research and analysis, and analytics/BI very well. Each of these functions must be a support for and work together with the others.
If your organization is new to strategic analytics, starting small might be the correct way to learn effective integration to maximize value, if you are already advanced with strategic analytics the question becomes how do you maximize the value of the entire organization from it?
Derrick McIver is a professor of management at the Haworth College of Business at Western Michigan University. He can be reached at [email protected].
References
Alamar, B. 2013. Sports analytics: A guide for coaches, managers, and other decision makers: Columbia University Press.
Cameron, W. B. 1963. Informal sociology: A casual introduction to sociological thinking: Random House New York.
Davenport, T., & Kim, J. 2013. Keeping up with the quants. Harvard Business School Press, Boston.
Kerlinger, F., & Lee, H. 2000. Survey research. Foundations of behavioral research: 599-619.
Marr, B. 2015. Big Data: Using SMART Big Data, Analytics and Metrics To Make Better Decisions and Improve Performance: John Wiley & Sons.
Sinek, S. 2009. Start with why: How great leaders inspire everyone to take action: Penguin.
Rasmussen, T., & Ulrich, D. 2015. Learning from practice: how HR analytics avoids being a management fad. Organizational Dynamics.
Welch, J., Welch, S., Primus, B., Winkelmann, H., Grawe, S., & Szymczyk, M. 2005. Winning: HarperCollins New York.


