Remember the feeling you’d get when you could retrieve the information you wanted on your own without having to ask someone to send it to you?
(sigh) Me, too…
There’s something about having the option of self-service that makes our lives easier and more accessible. Whether it’s the efficiency of buying a train ticket from a Billetterie in Paris, ordering dinner through our favorite food delivery app, or answering critical questions in seconds from a self-service BI report, we feel empowered without the need for advanced tech training.

From my experience, this is true for Higher Education consumers, too.
When I was a student, I loved being able to access my degree audit and run what-if scenarios:
– “What if I changed my major from Computer Science to International Studies?”
– “What if I pursued a double degree or a double major?”
– “What if I stopped going to Biology this semester?” (Not an example I’d suggest living out.)
Similarly, as a staff member and instructor, I loved the ability to:
– Understand student progress
– Know when critical systems were down
– See how many of my colleagues rallied their departments to contribute to the annual fund
…all without having to bother someone (or dial the university switchboard because I didn’t know whom to bother.)
Power BI has taken data democratization to another level.
Data democratization means making digital information accessible to everyone who should have access, without gatekeepers, request forms, or – in my case – university switchboard dialing. It’s a big part of the self-service paradigm that has gained significant strength in recent years thanks to demand and the pace of tech advancement in Power BI, regardless of industry.
In Higher Ed, we can specifically use these advances to prioritize students and promote an inclusive culture. We certainly saw the impact and needs during the last year of remote learning, with virtual and hybrid education taking place throughout the world.
And the capabilities continue to expand, including the democratization of artificial intelligence and data science and the integration of Power BI for Microsoft Teams.
So, what’s missing?
A need that has come up repeatedly with folks I have worked with is to earmark records for a specific purpose. As an example, when I worked at a small liberal arts college – a business user asked if there was an easy way to select a couple of records in a report and mark them with an X so she could follow up with them later about an upper-level course offering. At a larger university, the controller wanted ways to create an exception report for records that should be flagged to reconcile later.
In other words, sometimes end-users want to take action with their data quickly, and now they can with the integration of the Power Automate visual in Power BI.
Power Automate empowers us to go from insights to action.
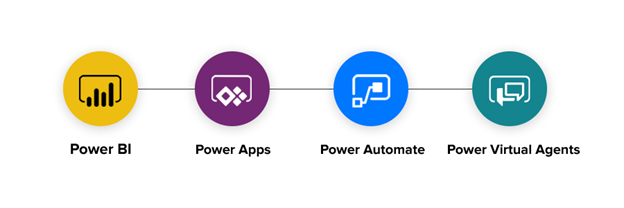
Power Automate (formerly known as Microsoft Flow) enables Robotic Process Automation (RPA) and is part of the Microsoft Power Platform collective: These four low-code tools can be used separately or together to support and improve productivity.
With the April 2021 Power BI update, we can now take action on Power BI reports interactively through Power Automate (preview).
Power BI + Power Automate in action.
The following demo is an example of Power BI + Power Automate in action, built on top of Microsoft’s Open Analytics for Education dataset:
As you can see, consumers now have a way to invoke actions with their selected data. In addition to updating an excel table from Power BI, some other helpful templates currently available to try include:
Learn More
If you want to learn more about Power BI and Power Automate together, including current limits and limitations, read more about it in the Microsoft documentation.
If you’re looking to learn more about all Power BI capabilities, 3Cloud has several resources to explore.
Contact us to learn how we can help you envision, build, and deploy a modern analytics platform.


