Gateway Performance Monitoring is a frequently overlooked but important part of Power BI governance. Many people think that as long as all data refreshes are successful through the gateway, and the gateway status is online, there is no reason to bother setting up a full-fledged monitoring and reporting process. Instead, they rely on occasional health checks and performance counters. Some administrators may run a Port Test, or open a log file or two during the monthly update process or when unit testing.
But when errors start to appear the Power BI Service, refresh queries begin to time out, and unhappy users and developers come knocking on your door, the ability to answer questions like the ones below becomes very handy:
- Is there a problem with throughput on one specific gateway node, or an entire cluster?
- Is there an issue with a particular data source?
- Are there any particularly inefficient queries that need to be optimized to improve user experience?
- How do we define inefficiency for DirectQuery (DQ) and Refresh activities?
- Are there too many scheduled refreshes running at the same time? Can they be better spread out throughout the day until a new node is added to the Gateway Cluster?
Even better is having the ability to predict potential throughput problems and simply scale gateway clusters up – or out – before troubles arise. By answering these questions, you can analyze Power BI usage and begin planning ahead :
- What are the most frequently accessed data sources?
- What proportion of traffic is DirectQuery, and what is Import? This can inform whether gateway nodes need to be more Memory or CPU heavy.
- When does the gateway have more activity? How does this change as deployment progresses and user counts grow?
- What are the overall trends in the gateway throughput?
In this blog post we describe how to gather necessary gateway log data, and providing a detailed overview of the report we designed to leverage it. We mention alternative options, and help you make sense of the data and tools made available by Microsoft.
Hopefully this will inspire you to enable Gateway Monitoring in your organization!
Gateway Logs: What They Are and Where to Find Them
In June 2019, Microsoft made Gateway Monitoring much easier via the addition of structured logs that can be enabled in the configuration file, and by providing a starter Gateway Performance Power BI report template to visualize the results.
These logs give full access to the information, minimizing the need to pull counter data from IT management systems, like the Microsoft System Center Operations Manager (SCOM); or run the Windows Performance Toolkit and dig through dust-covered gateway info and error log files; or pull refresh error messages from the Power BI Service. Enabling structured Gateway Monitoring logging doesn’t add any significant load to the server, so that’s another win.
As of January 2020, there are four log files, and these are the main things you need to know to follow along:
- Query Execution – Information for each individual query that was issued to an on-premises data source. It also has data about a parent Request ID. For example, user interacting with a visual in DirectQuery mode or user running on-demand dataset refresh each issue a series of various queries with two distinct Request IDs.
- Query Start – This one is essentially an extension of the Query Execution log with information about Query Start Time in Coordinated Universal Time (UTC) and base64 encoded full Query Text. In the context of the questions we are aiming to answer, this is pure gold!
- Query Execution Aggregation – Query Execution data aggregated for a predefined period grouped by data source, query type (DQ or Import Mode Refresh) and Query Status (success or a failure).
- System Counter Aggregation – Base performance data on CPU and Memory counters for a predefined aggregation period, grouped by counter. It captures data about system, gateway, and mashup engine.
As of the time of this writing, no information is available regarding the report name or dataset name that these queries were executed from. However, we can establish a link to Usage Auditing activity logs via the Request ID for on-demand data refreshes as a consolation prize.
See our companion blog post explaining Usage Auditing and Tenant Inventory done right!
There are a few additional parameters related to these logs that can be controlled in a main configuration file, such as aggregation period span, log file size, and number of log files of the same type to keep. It makes sense to change the last two from defaults when a centralized extraction and reporting process is established.
Connecting to These Data for Reporting
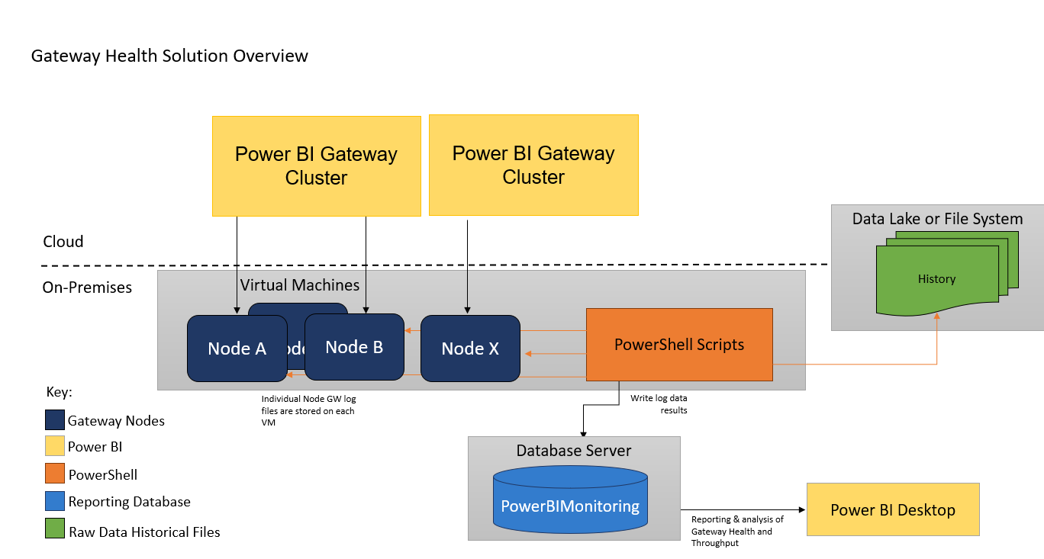
For organizations with less complex or voluminous data, a process to copy all log files from each respective gateway machine to a central location (file system or a data lake) may be preferred over the more robust architecture defined below. However, in the long run, we recommend implementing a full-fledged solution to extract and store these files in a designated Power BI Monitoring Database, coupled with additional Usage Auditing and Tenant Inventory data.
The example architecture for this process is shown in the image below:
Actionable and Effective Gateway Performance Report Design
Now that we are ready to consume the data and gain insights, what are the next steps to consider?
In June 2019, Microsoft released a report template, which is a great place to start to get data loaded and processed. There have been some great improvements to the template over the past several months, but in its current state, organizations would still have a lot of work to do to add more insightful, actionable visualizations, and a more intuitive report layout.
The Gateway Performance Report template, developed by BlueGranite, uses Microsoft’s as a starting point but expands and builds upon it to provide an actionable, easy-to-navigate, and use, report.
The most notable features include:
- A defined Gateway Node dimension, and classification of Gateway Objects by Cluster and Environment, such as Test and Production.
- An optional toggle switch between default UTC and desired local time zone.
- Parameters built specifically to track down long-running DirectQuery queries (threshold is in seconds) and long-running refreshes in Import mode (in minutes).
- Normalization of CPU counter data.
- The ability to run a comparison to a user-defined time period (also normalized) so that last week’s performance can be compared to last month, last quarter, etc.
- Actionable, easy-to-understand visuals.
- A full-fledged Data Dictionary to help user experience.
- Concise grouping of Data Source Types
The Data Model for the report has the following structure:
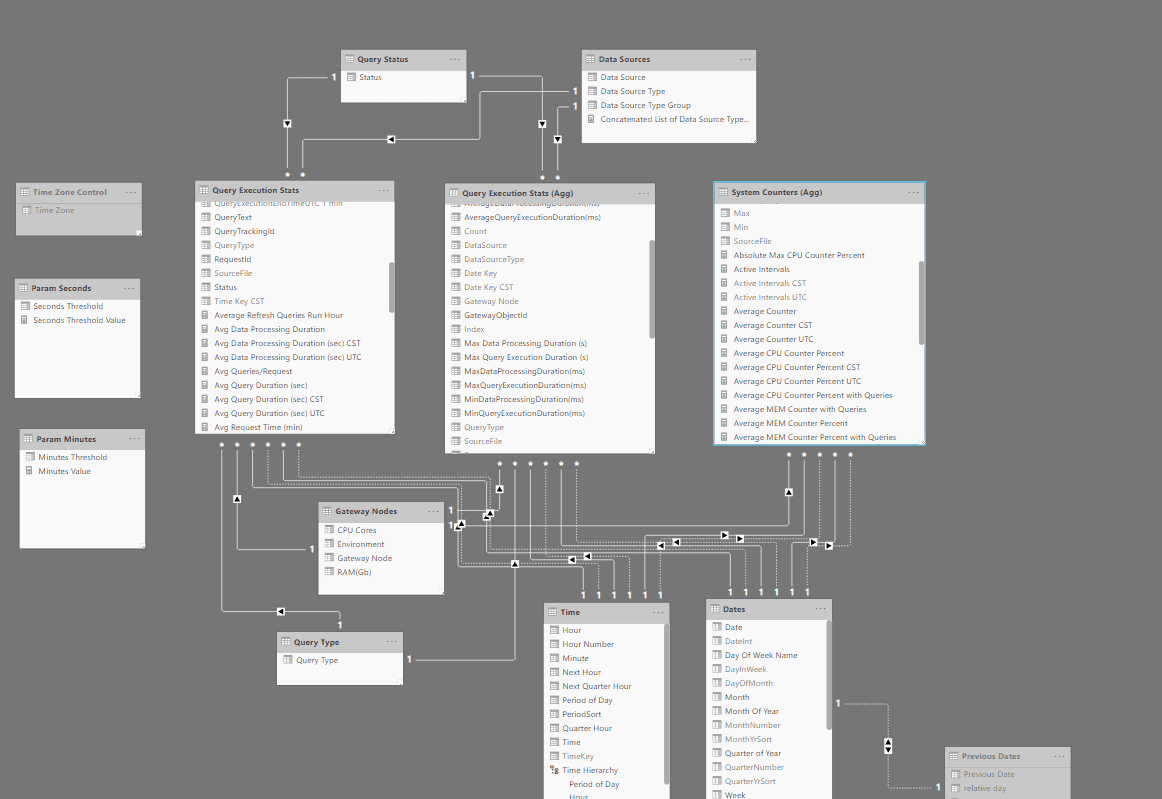
Primary Fact tables are the actual log files (please note that we chose to incorporate the Query Text field from the QueryStart log into the Query Execution Stats and not bring the entire log into the model). Primary dimensions are Gateway Nodes, Query Type, Query Status, and Data Sources, along with standard Time Intelligence ones. Inactive Relationship between Dates and Previous Dates is used to set up comparison period visuals.
In this example, the client also wanted the Time Zone switch toggle to display data in local time. We accomplished this using role-playing Time and Date Dimensions, and a disconnected Time Zone Control table. Every Measure was configured with a SWITCH() DAX. Additional time zones can be added to accommodate users in different global locations.
The first page of the report provides insights into CPU metrics with options to display charts and comparisons for max or average counter value within the aggregation period, and during times when actual query activity was occurring. All CPU counters are normalized by the number of CPU cores, so that the maximum value will not exceed 100%. A warning line is placed on the line chart and alerts can be set up in the Power BI Service to email responsible team members.
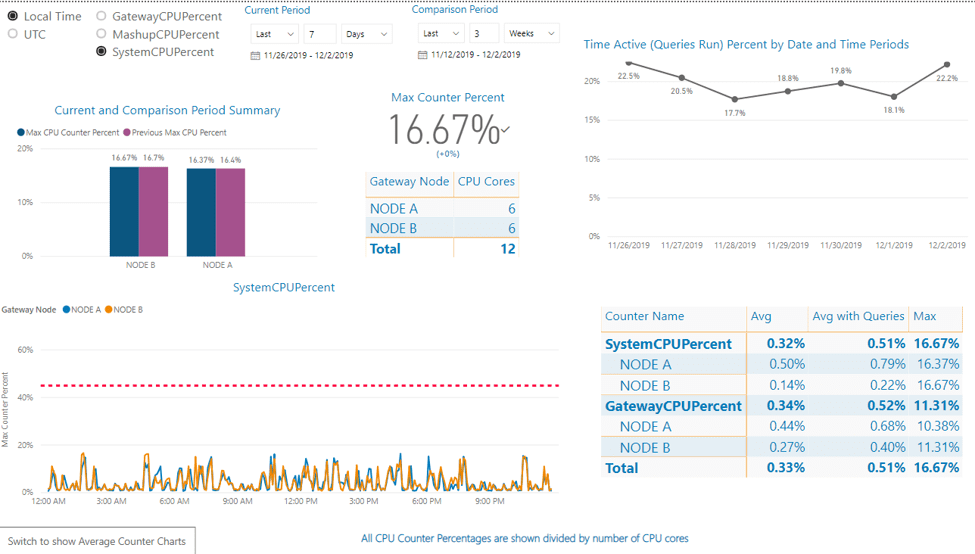
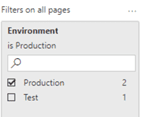
The environment variable is added to the ‘Filters on all pages’ pane to allow users to quickly switch between Production and Test Clusters:
The Memory Counters page is set up very similarly to CPU.
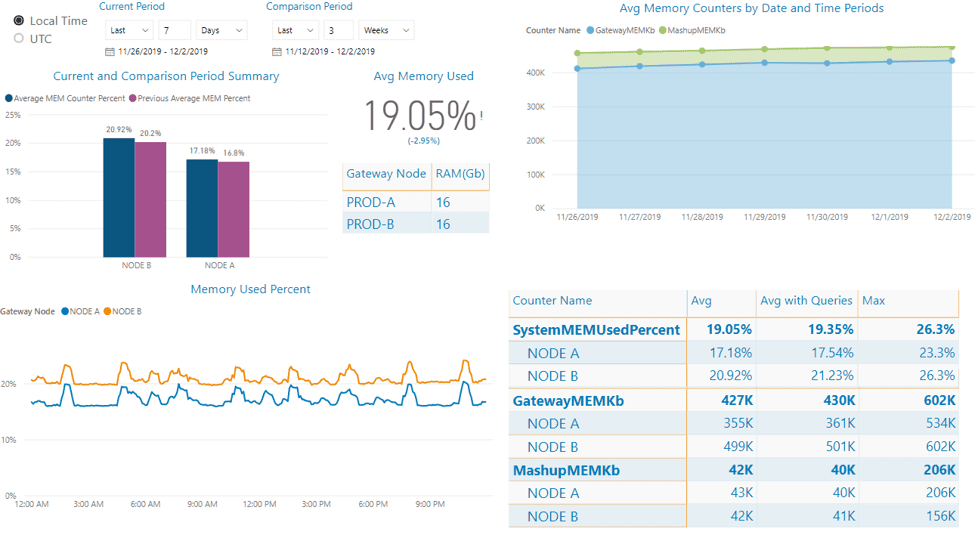
In this particular case, a responsible IT team member may want to take a look at NODE B to see why average memory usage is slightly, but consistently, higher. It could be something simple as a different verbosity level setting enabled in a core configuration file.
The Query Throughput Page is our main knowledge gold mine, providing insights into the type of queries run, their total counts, and frequency. By looking at the Average Daily Query Throughput column chart, with a filter set to display only Refresh values, one can see the busiest times.
Conditional formatting can be set to notify report viewers when these values exceed a certain threshold. In the visual below, it looks like very few daily refreshes are set to 9 a.m. local time. When a new set of reports are published to the service, this time slot can be recommended.
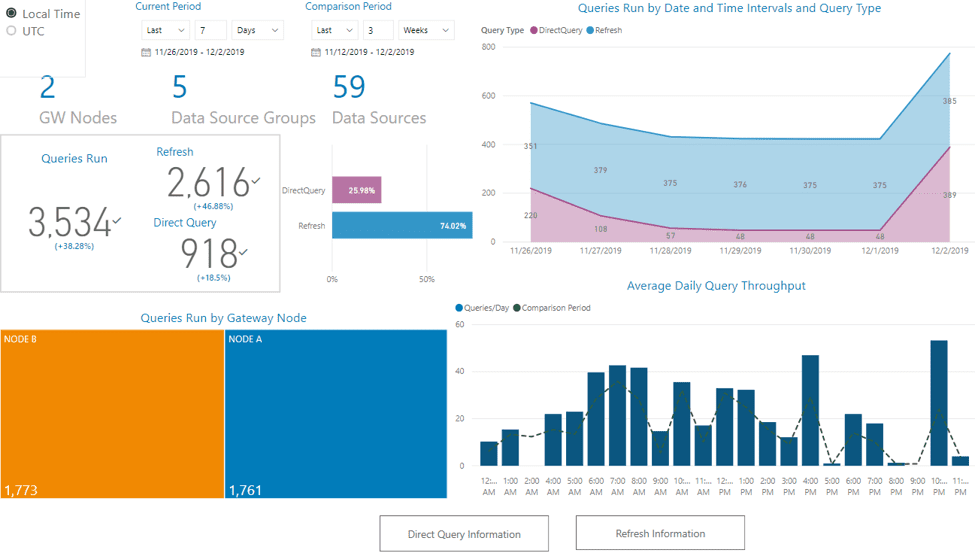
If the Queries Run by Gateway Node tree map visual does not show a fairly even split among the load on all gateway nodes in the cluster (with the load balancing set to on in the Gateway Admin portal) – Houston, we’ve got a problem!
The next level in the hierarchy will display Data Source Type Groups, which are derived from the initial Data Source Types category provided in the Microsoft template by folding duplicate types, so that SQL+Web and SQL+Web+Web+Web sources will show in the same category. Actual data sources are another level down.
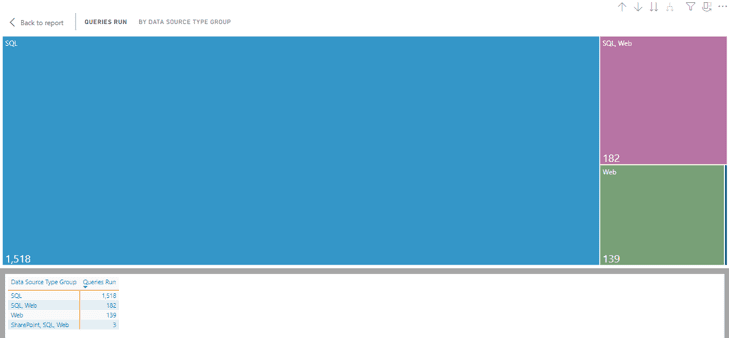
“Wait a minute!” one may say. “I thought cloud sources did not go through the gateway; where are those Web ones coming from?” The web sources you see here are either internal URLs or references to files stored on SharePoint Online with an Organizational-level privacy policy, so when a query is issued to a SQL database on-prem, using data from an online source, one will see both sources listed in the logs.
It did not make sense to apply the same criteria to analyze DirectQuery and Refresh activity; hence, we designed two separate pages of visuals to highlight what matters most.
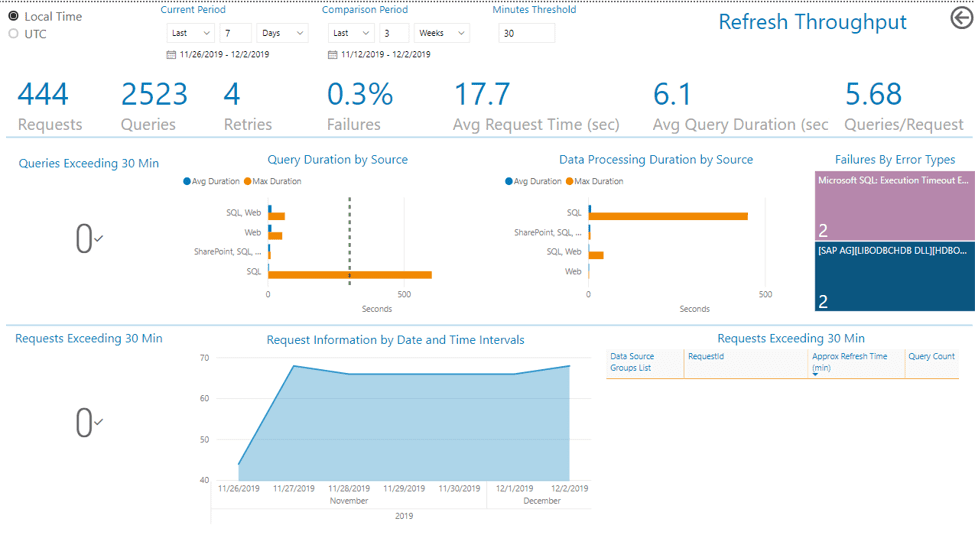
Looking at the key cards, one can quickly see how many queries and requests there were, the average query and request execution times (in this case, a report-interaction level), if there were any failures, and what, exactly, the errors were.
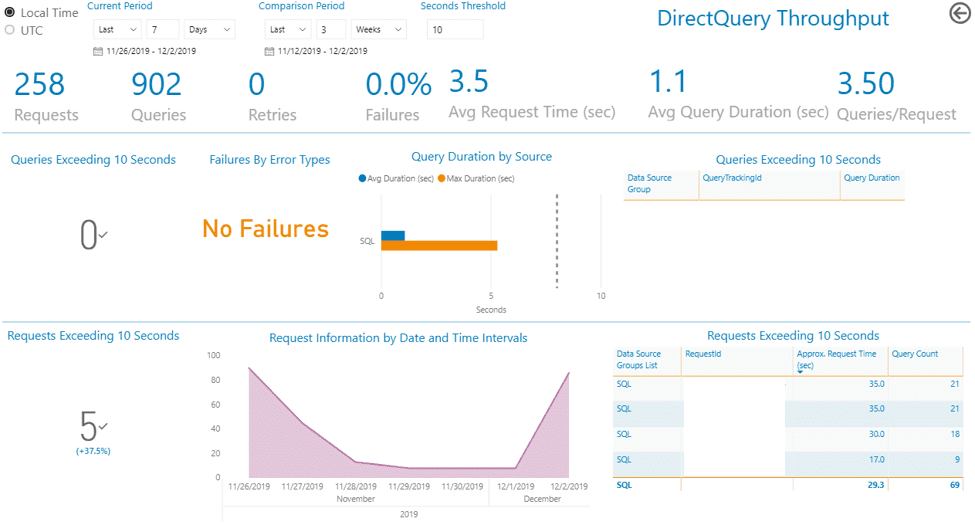
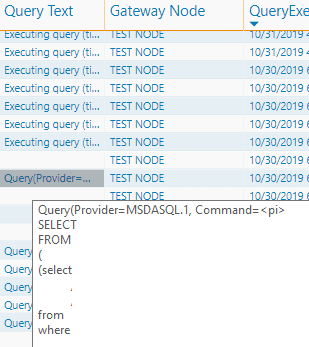
For DirectQuery we are tracking performance in seconds. We wanted an easy way to find both queries and their parent requests taking longer than a certain time to execute. The Seconds Threshold parameter will filter the table visuals to display just the queries over an established length. From there, a detailed Drillthrough page is set up to show all corresponding queries, data sources, execution times, and full, decoded Query Text, which is our best partner in this detective work.
In the example above, we do not see any queries taking longer than 10 seconds to execute, however we can see some requests taking that long, due to a larger number of shorter queries running together. We can advise report designers to disable unnecessary visual interactions, or check whether there are other optimization techniques we can employ.
For refresh activities that are usually performed over larger datasets, and queries and transformations that would not have been possible in DQ, we are thinking in minutes for our threshold parameter. Data Processing duration also comes into play here.
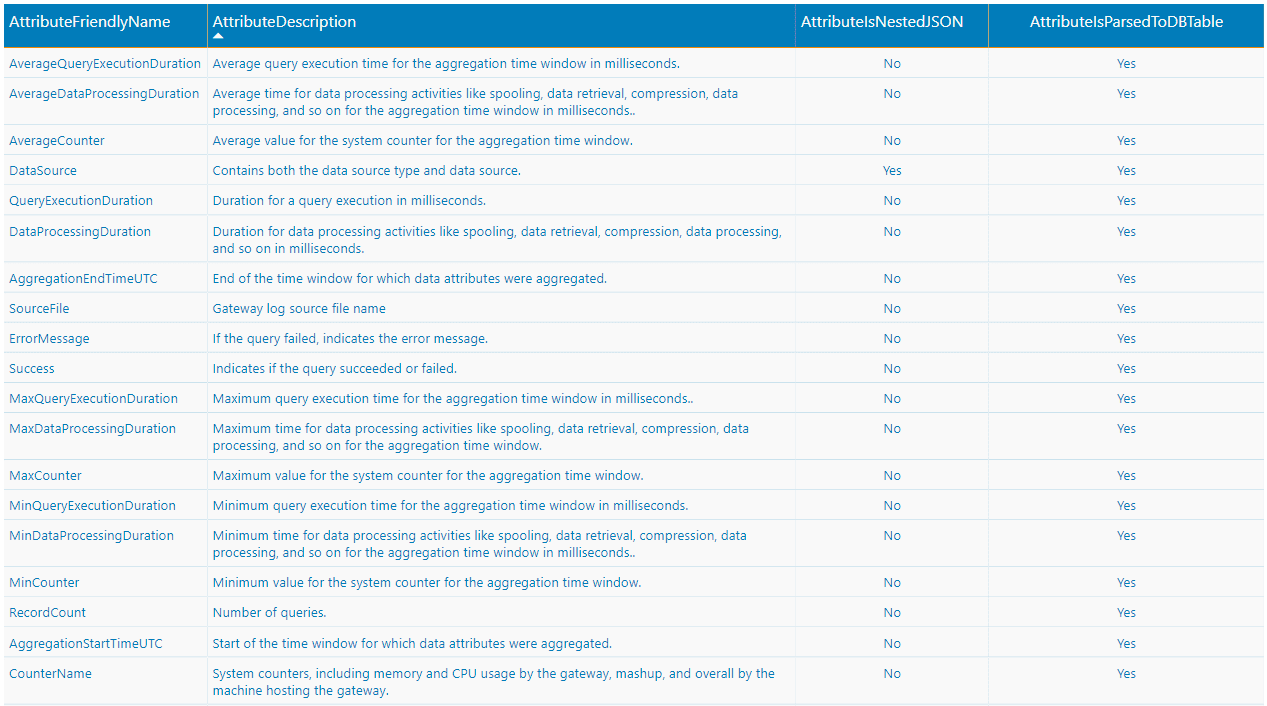
Finally, we added a Data Dictionary to help users make sense of the data.
We hope our insights can encourage Gateway Performance Monitoring in your organization, and inspire report design.
BlueGranite is committed to continuously evolving our solutions. Contact us today – we welcome feedback and are eager to hear about any other visuals or report design features that could be useful to you! For more information and resources on Modern Business Intelligence and Power BI deployment, check out our Modern BI resource page.
Good to Know
It is worth a reminder that the picture will not be complete without also establishing the Usage Auditing and Tenant Inventory reporting mentioned earlier, and described in our companion blog post. These can help you find unauthorized personal gateways, unused data sources, and maintain full access lists.
In addition, please keep in mind that it is still possible for scheduled refreshes to fail on the service, but not show errors for these requests in the gateway logs. In cases with complex models, using both cloud and on-premises sources when refresh is executed, the cloud source can time out or throw an error that will fail the refresh, while all gateway log activity completed by that point in time for this same request will show successful queries going through to sources located on-premises.
Additional Links
Instructions on how to set up Gateway Logging and the Microsoft Gateway Performance Power BI template download are available here.


