
Whether you are a small retailer looking to see if your seasonal inventory is selling or a large manufacturing plant organizing equipment maintenance costs, your business can benefit from self-service business intelligence. In this blog, you’ll learn some fundamentals of data analytics and data visualization, Microsoft business intelligence tools, and critical business intelligence use cases.
What is Business Intelligence?
Business Intelligence (BI) is an umbrella term that refers to tools and services that transform raw data into actionable insights. Data analytics and data visualization tools provide users with the knowledge or detailed intelligence about their business state. The main goal of BI is to help users easily interpret large volumes of data. The insights can further help a business identify new opportunities, reduce costs, or mitigate potential risks. BI allows companies to implement an effective strategy that can eventually provide a competitive advantage, along with long-term stability.
Some everyday use cases for data analytics and data visualization are reporting, ad-hoc analysis, and dashboard development.
Dashboard reporting (76%), ad-hoc analysis (57%), and dashboard authoring (55%) are the top cloud business intelligence use cases, according to G2.
What is the difference between traditional BI and self-service?
Self-service business intelligence tools allow business users access to data and present the information for analysis without going to IT departments.
According to Tech Jury, 64% of business owners say that self-service platforms provide a significant competitive advantage.
Traditional BI depends on IT departments to develop reports, analyze data, and share insights. Often when businesses go through IT for analytics support, requests can take days to complete. By the time the business would get their reports, they will already be “outdated.” In today’s world, companies need to be agile and make fast decisions based on the latest relevant data, and this approach is becoming less and less effective. Instead, both small and large organizations turn to self-service BI to empower business users and decision-makers to explore data, build their up-to-date reports and dashboards, and get instant access to insights anytime and anywhere.
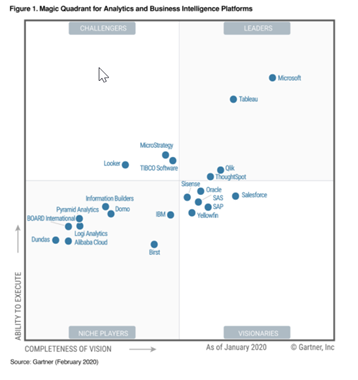
Today there are quite a few self-service analytics tools available on the market, but according to Gartner, Microsoft Power BI has been the leader in this sector for the past 13 years.
What is Microsoft Power BI?
Power BI is a collection of tools, apps, and software that allows you to get fast and easy access to your data. Power BI is one of Microsoft business intelligence tools that help visualize your data, enables you to collaborate with the entire organization, and share your data collection and reports with others. It allows users to visualize their data anywhere and anytime and on any device. With Microsoft Power BI, you can connect to various data sources from spreadsheets and cloud services to on-premises databases, enabling a holistic 360-degree view of your business. This visibility ensures that your team uses the correct data and able to make quick and confident decisions.
96% of the Fortune 500 now use Power BI to find insights into their data, according to Microsoft.
Power BI Ecosystem
The first component of the Power BI ecosystem is Power BI Desktop. Microsoft Power BI Desktop is a program that you download and install locally on your machine, and it is entirely free. Power BI Desktop is the tool that business users and analysts will use to create Power BI reports to extract insights from their data and perform data exploration and analysis.
After creating a report, the next step is sharing them with other stakeholders. And here, all you have to do is take your PBI report and publish it to Power BI Service, which is essentially a Cloud version of Power BI Desktop.
If your business is not yet using Cloud services, you can still publish your reports for collaboration using an on-prem version called Power BI Report Server. This tool hosts your reports within your firewalls, and all data stays on your intranet. After you publish your reports either to PBI Service or PBI Report Server, you can access them anytime and on any device, iOS platform, Android, or Windows.
And finally, the Power BI analytics tool has some very impressive development capabilities. For example, if there is a particular visual that your organization wants to continue using, it is possible to replicate it in Power BI using code. Another example is taking PBI reports out of the PBI ecosystem and embedding them into custom enterprise applications or integrating them on a company’s web page or SharePoint.
New Features and Capabilities
Microsoft continues to improve Power BI. In 2019 alone, they have added hundreds of new features, including decomposition tree visuals, LinkedIn data connectivity, and geographic mapping enhancements. Power BI also has impressive innovative capabilities for augmented analytics and automated ML. AI-powered services, such as text, sentiment, and image analytics, are also available within Power BI and draw on Azure capabilities. Both in Power BI Desktop and Service, we can now talk to our data using the Q&A feature. When we ask questions using this functionality, Power BI generates the visualization as per the keywords. The visualization is a rapid process. It gets the user the ability to interact with data and maybe even get some inspiration on what visual to use for their report or dashboard.
Go outside of the box
Enterprises looking to get more from their Microsoft business intelligence tools can leverage 3Cloud, data, analytics, and cloud company. 3Cloud provides in-depth Microsoft Power BI Consulting custom training to users depending on their skillset, use cases, and experience. If you are interested in learning more, contact 3Cloud for custom Microsoft Power BI training.


