
Microsoft was a late mover into the Data Discovery space when they first launched Power BI in late 2014, but since then they have closed the gap with many of the main competitors in that market. One of the ways they have been able to close that gap is with the integration of several open-source languages such as R. In this quick exercise we will create a simple linear regression model in R based on stock price data for Microsoft and then import that dataset into Power BI for visualization.
Getting the Data
Yahoo! Finance is always a good source for stock data, and we can connect to a (CSV) file of the Microsoft data using the following link:
http://chart.finance.yahoo.com/table.csv?s=MSFT&a=6&b=17&c=2016&d=7&
e=17&f=2016&g=d&ignore=.csv
We will call this default dataset Microsoft_df. A preview of the dataset can be seen below.
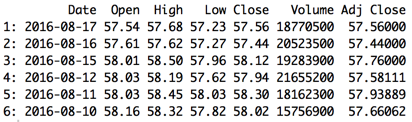
Once we have the dataset, we can run a few lines of R code to bring the data in and apply a simple linear regression against the Adj Close column, which is the closing stock price of Microsoft.
#Begin R Code
install.packages(‘data.table’)
library(data.table)
Microsoft_df <- fread(‘http://chart.finance.yahoo.com/table.csv?
s=MSFT&a=6&b=17&c=2016&d=7&e=17&f=2016&g=d&ignore=.csv’)
head(Microsoft_df)
Microsoft_df$RowCount<-seq.int(nrow(Microsoft_df))
StockRegression<-lm(`Adj Close`~RowCount, Microsoft_df)
New_DataFrame<-cbind(Microsoft_df, Fitted=fitted(StockRegression))
#End R Code
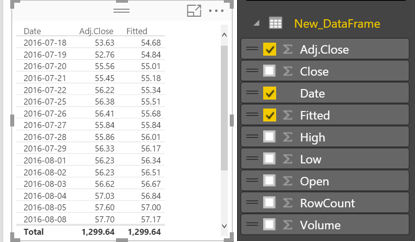
The new dataset after applying the linear regression model to the Adj Close can be seen below. We called it New_DataFrame.
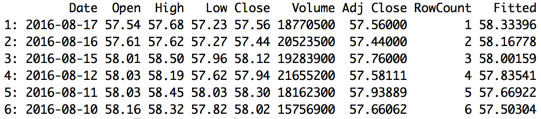
Two additional columns have been created: RowCount and Fitted column. The RowCount was used to assist with the regression calculation, and the Fittedcolumn was the output that we will want to visualize.
Connecting to Power BI
We are now ready to Get Data into Power BI.
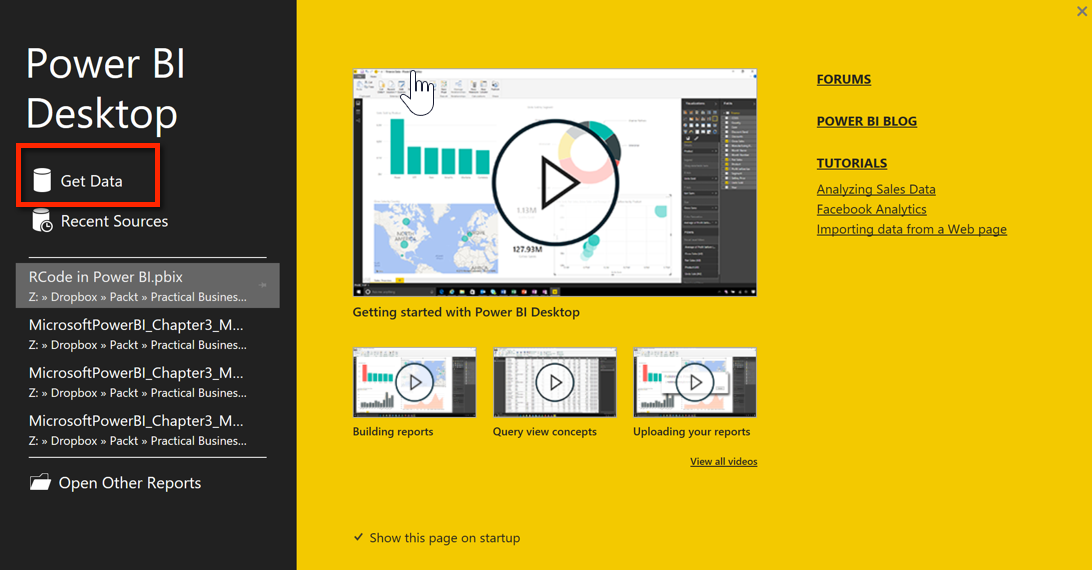
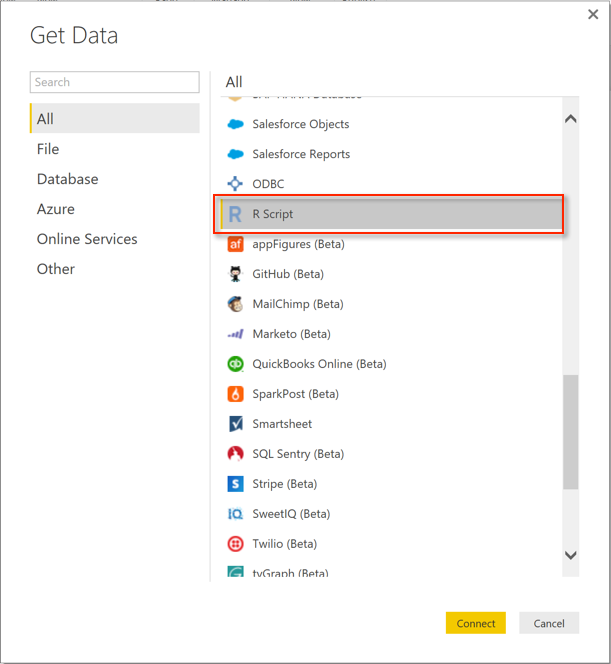
There are a plethora of data sources available for connectivity with Power BI. We just need to find the R Script connection.
Of course, we want to make sure that R is installed on the same machine that has Power BI running!
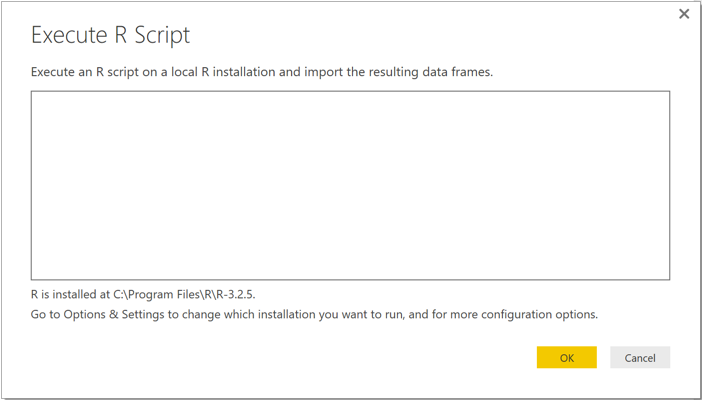
Once connected, we are prompted with a blank editor screen asking us for our R Script.
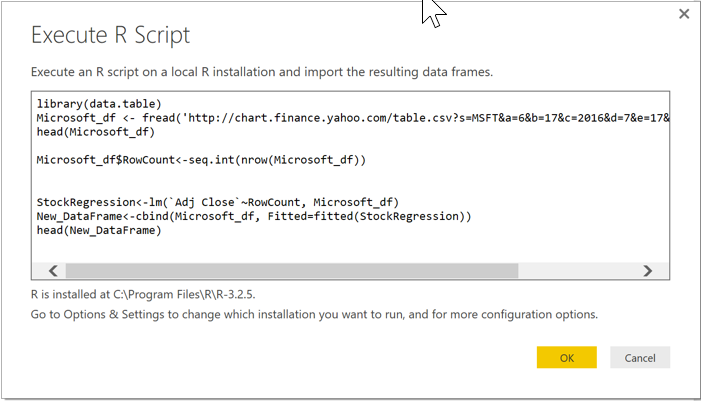
We can copy and paste our R code into the editor and execute.
When pasting into the Power BI editor, we do not need to include code for installing R packages. That is only required to be done once and through R itself.
Once the script is executed, we view all of the available datasets that were produced from the R code we pasted in.
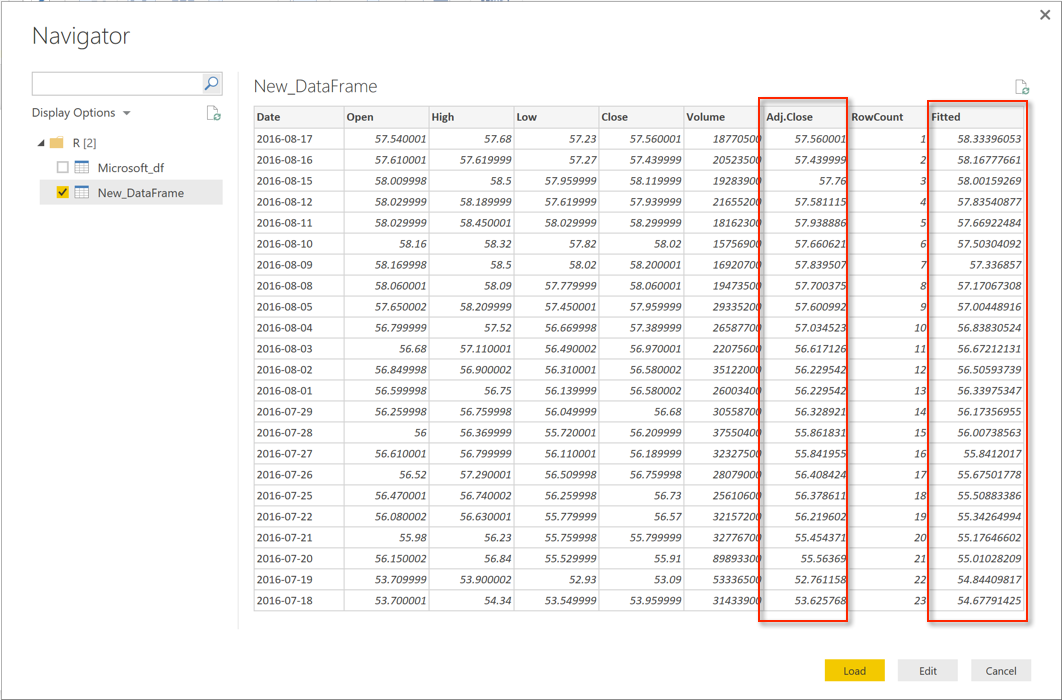
In our case, we had our original dataset (Microsoft_df) and the derived dataset (New_DataFrame). For our purposes, we are only interested in loading theNew_DataFrame. Once the new dataset is loaded, we can select the appropriate fields for visualization and few the results.
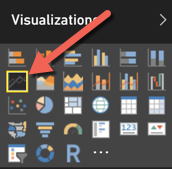
We can change the default view from a table to a line chart by selecting the visualization picker on the right-hand side.
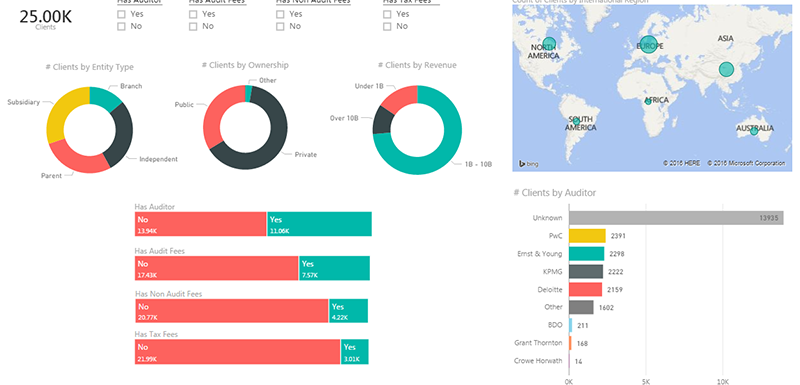
We can now see our new data visualized in Power BI with our original Adj Close as well as the Fitted points against the Date.
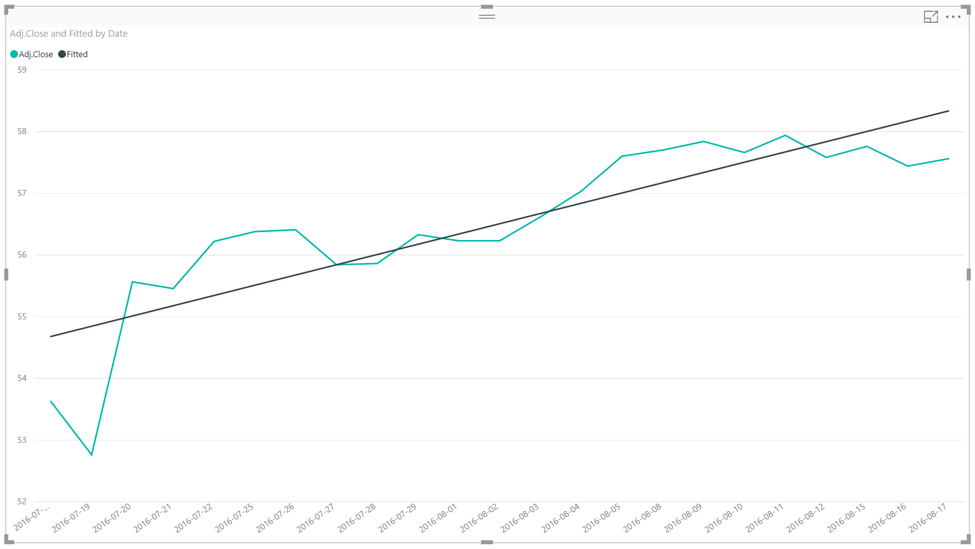
We can see that while Microsoft stock has had a few peaks and valleys over the 23-day period, overall, they seem to be trending upward according to this simple linear regression model.


