Tableau 9.0 is finally here and with it – a lot of community excitement. Among all the new great features, there is one in particular that makes this product very compelling. Level of Detail expressions are an enhancement to Tableau’s calculation language that provide finer control over the context of business calculations.
You might be wondering: Why is this important? Didn’t Tableau already have robust functions for creating business metrics?
Yes, but allow me to explain. Since its inception, Tableau has been highly regarded as a sophisticated visualization tool. At the same time, Tableau’s heavy reliance on visual elements when computing business metrics has been criticized. It is not uncommon to hear IT folks argue that data modeling should be an abstraction not directly tied to any visual representation of the data.
They carry this perspective for a simple reason: dynamic, portable calculations that can work under different reporting contexts — not just a single report view — are easier to maintain and hence represent a “better practice.” This is why Level of Detail expressions are so important — they push Tableau a bit more into the world of abstract modeling, allowing users to create calculations that are less dependent on visual elements.
For example, let’s say we want understand the relative contribution of a product subcategory to the overall sales for any given year:
Product Subcategory Sales
Total Year Sales
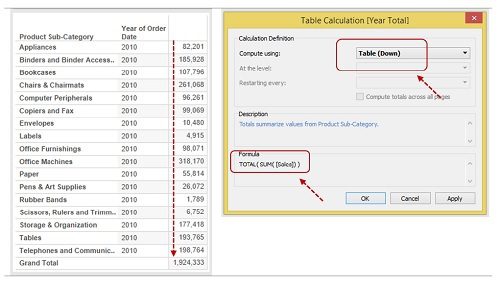
Prior to Tableau 9.0, we would use a table calculation to compute the denominator. The screenshot below shows how this would work, calculating a total from the top to the bottom of our visualization:
That looks simple enough. By using this context for the denominator, we can now see which product sub-category was the top contributor:
Assume I share the visualization with power users who want to explore data further. A logical approach may be to narrow their analysis (select office machines as the top contributor) and then drill into details (to see products that belong to this sub-category).
Tableau allows users to narrow the analysis by using the “Keep Only” menu option shown below, and filter on a specific value:
This intuitive report interaction has an unfortunate consequence: Our denominator has lost its “context” and now the contribution metric incorrectly shows a 100 percent contribution to the year total. (Remember: office machines only contributed 16.53 percent to the year total)
If we drilled into office machine products, we would see a chart that makes little sense, showing that all products contributed 100 percent to the year total!
To a regular business user this behavior may seem totally wacky. Why would our filtering behavior affect the calculation output?
Table calculations, in Tableau, have been traditionally tied to what is being represented or defined as the level of detail in the visualization canvas. A “Year Total” calculation may or may not represent the actual total for the year, depending on what you are plotting in your visualization. There are tricks to get this to work, but sometimes too complex for regular business users.
Fortunately, in Tableau 9.0 we can now provide a much more intuitive behavior using elegant Level of Detail expressions. These provide increased calculation re-usability under broader reporting contexts, which is a great modeling improvement.
By re-defining the denominator with the following expression, Tableau will “retain” the context of the calculation even after filtering product sub-categories:
This Level of Detail expression does not require any additional settings as we would use with traditional table calculations.
Now, when drilling into product details, the chart will maintain the correct year total as the denominator, no matter what is being represented in the chart. This allows us to see the top contributor at the product level:
By using Level of Detail expressions you can create more “abstract” calculation logic with reusable metadata users can benefit from. Self-service data explorations will improve given users will have to rely less on having specific visual elements already configured before the calculation can offer analytical value.
Are you getting the most out of your Tableau investment? 3Cloud can help. We plan, design and build solutions using Tableau technology, and can help you scale self-reliant BI in your organization. Let us know how we can help you get the maximum ROI from your analytics technology. Contact us today to learn more. Or, if you are interested in trying Tableau for yourself, click here for a free 14-day trial of Tableau Desktop.


