If you take your car to the mechanic, throw your keys on the counter, tell them your car is performing poorly and walk out, odds are the problem won’t get fixed. For the mechanic to be successful, they need to know the answers to the following questions:
- Which part is performing poorly?
- When did the problem start?
- Has there always been a problem?
- Is there anything that makes it work better?
- Does it only malfunction under certain conditions?
These questions can also be applied to any performance problem in any system — and Microsoft’s Power BI is no exception.
But if you’d like to improve your Power BI performance, you first need to understand the major parts of Power BI and how they work together so you can better isolate the issue and quantify what your performance problems are.

What are the components of Power BI?
If you are creating reports, your first exposure to Power BI is usually through the Power BI Desktop, Power BI’s free integrated development environment that gathers, transforms and models data for the reports you create. Hidden under the hood is a full-featured instance of SQL Server Analysis Services Tabular Engine, which hosts the in-memory data models you create.
Speaking of data, Power Query Editor wrangles and mashes data that is built in Power BI desktop, allowing you to import and transform data from various data sources using either a graphical interface or manually written scripts in the Power Query Formula Language (otherwise known as M).
Data can either be imported into a data model that is stored in your data file, or you can use a feature called Direct Query to connect to data stored in a different model such as Azure Analysis Services to build reports without pulling all of the data to your Power BI desktop instance.
Once you have built your model and your reports, you publish these reports to the Power BI Service, which has two tiers of service: Power BI Pro and Power BI Premium.
Improving Power BI performance
Now that we have talked through the general Power BI system components, let’s talk performance! The scope of this blog will cover import models (where data is imported to Power BI Desktop and built into a data model) in the Power BI Pro service tier. Power BI Premium and Direct Query performance tuning will not be included in this blog post, but if there is interest in those areas, please let us know.
In part I of this performance series, we will look at improving performance in your model, the heart of an import Power BI report solution.
Turn off auto date/time
Hands down, reducing the model size will provide the biggest return on investment for hours spent optimizing Power BI performance. Tabular model speed and efficiency come from loading data into RAM and working with it there. Thus, the smaller your model is, the faster it will be. Even faster than RAM is the L1 and L2 CPU Caches in today’s modern CPUs. To put it simply: smaller is better.
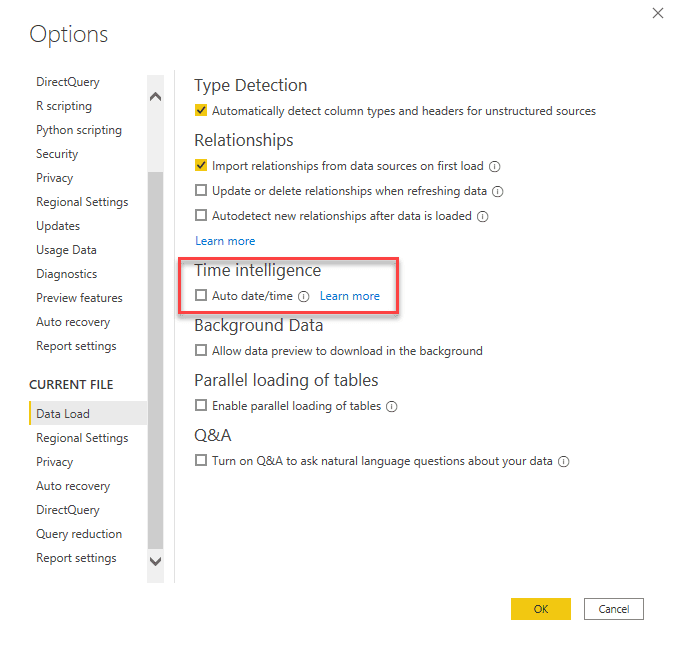
My very first step when I look at a new model is to see if the user has Auto Date/Time enabled in Power BI Desktop. Power BI documentation describes this feature as allowing report authors to easily use calendar time periods to drill down into your data without you having to build out a specific Date dimension. This sounds like a great idea at first, but its implementation means that for each date column used in your data, a hidden date/time table is created in your model.
With a reasonably large amount of data at a daily grain, you can easily start to chew up a lot of memory on these temporary date tables. How much memory, exactly? A recent customer model that I reviewed went from 860mb to a mere 122mb — or a 7:1 compression — just by turning off this feature.
Important note: If you haven’t built your own date/time dimension tables, turning off Auto Date/Time will break your reports — but that just gives you all the more reason to set up your own dimension tables now. By the way, since these are hidden tables, you won’t even know that Power BI is creating them in the background unless you connect with Dax Studio, so you could be running a lot of bloat that you don’t even know about.
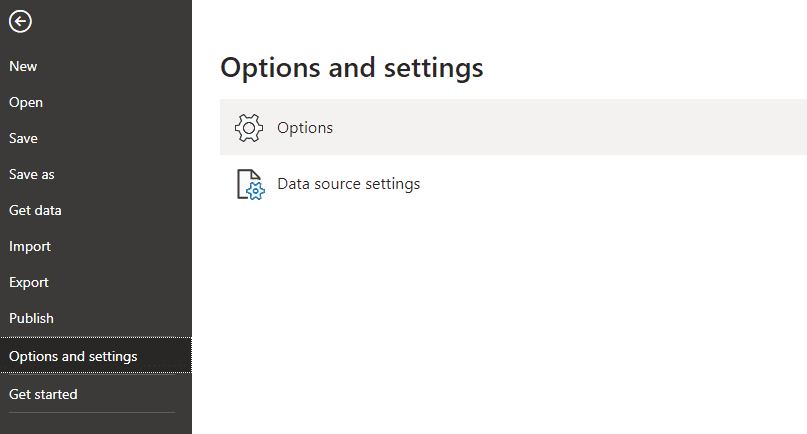
To see if Auto Date/Time is enabled, Select File from the ribbon and choose ‘Options and Settings – Options’ as shown.

Once the options screen comes up, scroll down to the ‘CURRENT FILE’ section and look for ‘Time Intelligence’ as shown. Make sure that the box is unchecked.

Check this one first, you won’t ever be able to do anything else with such a high rate of return as this step.
Remove unnecessary columns
Our next performance tip is also easy to do: get rid of ALL the columns you have pulled in that you are not using. Even if it’s one of those columns that you think you might use later, do yourself a favor and get rid of it. Smaller is better, remember? If you aren’t using the data, get rid of it.
Eliminating these columns could make a huge difference when it comes to compression of the data model and things like optimizing sort order. Tabular databases are built to be stored in memory, so the less data you have stored, the better.
Tabular databases shift the IO pain from disk to CPU & RAM and, let’s face it, CPU and RAM speed increases have far outstripped disk IO performance. This means that you have to be able to store large amounts of data in RAM or CPU cache. To do this, tabular databases such as the Vertipaq engine in SSAS Tabular and Power BI use highly efficient compression algorithms to store the data. The details of the algorithms are outside the scope of this blog post, but simply put:
- You get better compression with lower cardinality (i.e. unique) data
- If the engine can find a way to sort the data to increase its compression, it will do that.
For example, if the Vertipaq engine can replace a commonly occurring string or number with a smaller variable, it will do so to save space. Columns that have highly unique data like DateTime columns or identity columns should be removed if they are not being used because the Vertipaq engine will struggle to find ways to compress those columns.
Build efficient models
It’s easy to forget why we build reporting models in the first place. When you design a typical database, you attempt to:
- Organize or normalize the data in a structure that reduces redundant data
- Enforce relations between the data structures that align with the business logic behind the data.
Oftentimes, the emphasis with databases is on writing high amounts of data and saving space to limit disk IO. To this end, data in these databases is often highly normalized to reduce redundancy and provide structural integrity.
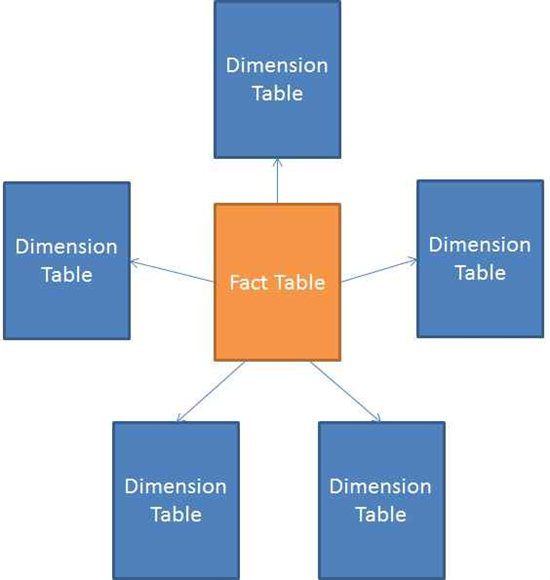
For reporting models, however, the design specifics are different. Reporting models are usually not updated as much or in real-time, and the focus is on reading large amounts of data quickly so that it can be aggregated and displayed. For the data models used in Power BI Reporting, star schema models are the gold standard. Star schemas have fact tables and dimension tables, and when diagrammed, the dimensions typically align with the fact tables giving it the star shape shown below:

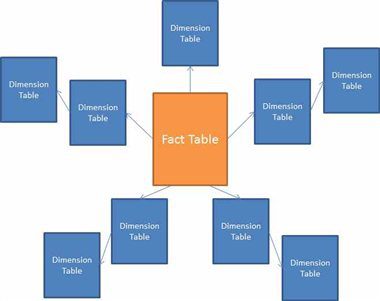
There is a closely associated model design referred to as the snowflake model where the dimensions can be normalized into further sub dimensions to reduce the redundancy of the data. You end up with a diagram that looks more like this:

From a performance perspective, the reason a snowflake schema is not recommended is that each of those sub dimensions represent an additional JOIN statement in your queries. This presents difficulties in Power BI, where instead of simply joining a fact table to a dimension table, a snowflake schema creates as many joins as you have sub dimension tables — for example, two joins in the diagram above. Since joining these tables together hinders performance, the less you have the better.
The immediate question, then, is why you wouldn’t use anything other than one large, flat table (think of a spreadsheet) without breaking out fact and dimensions? While that technically might work, you can run into other problems with that design.
- A large flat table will be harder for your users to navigate if they want to make reports from your model or even understand how it is put together.
- Adding another fact table in the future that uses the same dimensions will be more difficult.
- The wider the table, the harder it will be for Vertipaq to find its ideal sort to compress that data.
Several performance documents from Microsoft also seem to indicate that the internals of DAX and the Vertipaq engine will run best against a star schema model.
Recap
So, that’s part one of my Power BI Performance series. We talked about model size and design because that’s usually the place where you really can make the maximum impact on performance with the least amount of work— so it’s best to start there.
In later blog posts in this series, I will look at the performance of your visuals and reports, as well as what not to do as a Power BI Developer if you want quicker refresh times and a better IDE experience in Power BI Desktop. Read the next blog in this series here.
Struggling with Power BI Performance issues? Join our weekly Power BI Office Hours to learn how we can work with your business to help you be more successful with Power BI.


