
With the Data Lakehouse architecture shifting data warehouse workloads to the data lake, the ability to generate a calendar dimension (AKA date dimension) in Spark has become increasingly important. Thankfully, this task is made easy with PySpark and Spark SQL. Let’s dive right into the code!

How to Begin
The process starts by generating an array of dates, then exploding this array into a data frame, and creating a temporary view called dates.
from pyspark.sql.functions import explode, sequence, to_date
beginDate = '2000-01-01'
endDate = '2050-12-31'
(
spark.sql(f"select explode(sequence(to_date('{beginDate}'), to_date('{endDate}'), interval 1 day)) as calendarDate")
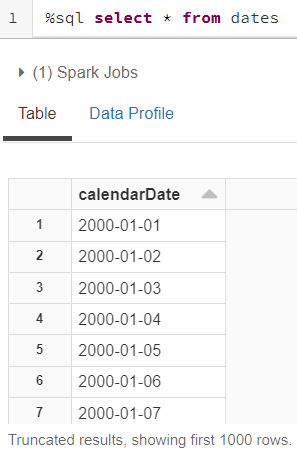
.createOrReplaceTempView('dates')
)The dates temporary view has a single column, with a row for every date in the range specified above. It looks like this:
Now that we have a temporary view containing dates, we can use Spark SQL to select the desired columns for the calendar dimension.
select
  year(calendarDate) * 10000 + month(calendarDate) * 100 + day(calendarDate) as dateInt,
  CalendarDate,
  year(calendarDate) AS CalendarYear,
  date_format(calendarDate, 'MMMM') as CalendarMonth,
  month(calendarDate) as MonthOfYear,
  date_format(calendarDate, 'EEEE') as CalendarDay,
  dayofweek(calendarDate) AS DayOfWeek,
  weekday(calendarDate) + 1 as DayOfWeekStartMonday,
  case
    when weekday(calendarDate) < 5 then 'Y' else 'N' end as IsWeekDay, dayofmonth(calendarDate) as DayOfMonth, case when calendarDate = last_day(calendarDate) then 'Y' else 'N' end as IsLastDayOfMonth, dayofyear(calendarDate) as DayOfYear, weekofyear(calendarDate) as WeekOfYearIso, quarter(calendarDate) as QuarterOfYear, /* Use fiscal periods needed by organization fiscal calendar */ case when month(calendarDate) >= 10 then year(calendarDate) + 1
    else year(calendarDate)
  end as FiscalYearOctToSep,
  (month(calendarDate) + 2) % 12 + 1 AS FiscalMonthOctToSep,
  case
    when month(calendarDate) >= 7 then year(calendarDate) + 1
    else year(calendarDate)
  end as FiscalYearJulToJun,
  (month(calendarDate) + 5) % 12 + 1 AS FiscalMonthJulToJun
from
  dates
order by
  calendarDate
When you’re satisfied with the results, the same query can be used to load the calendar dimension into a Delta Lake table and register it in the Hive Metastore.
create or replace table dim_calendar
using delta
location '/mnt/datalake/dim_calendar'
as select
year(calendarDate) * 10000 + month(calendarDate) * 100 + day(calendarDate) as DateInt,
CalendarDate,
year(calendarDate) AS CalendarYear,
date_format(calendarDate, 'MMMM') as CalendarMonth,
month(calendarDate) as MonthOfYear,
date_format(calendarDate, 'EEEE') as CalendarDay,
dayofweek(calendarDate) as DayOfWeek,
weekday(calendarDate) + 1 as DayOfWeekStartMonday,
case
when weekday(calendarDate) < 5 then 'Y' else 'N' end as IsWeekDay, dayofmonth(calendarDate) as DayOfMonth, case when calendarDate = last_day(calendarDate) then 'Y' else 'N' end as IsLastDayOfMonth, dayofyear(calendarDate) as DayOfYear, weekofyear(calendarDate) as WeekOfYearIso, quarter(calendarDate) as QuarterOfYear, /* Use fiscal periods needed by organization fiscal calendar */ case when month(calendarDate) >= 10 then year(calendarDate) + 1
else year(calendarDate)
end as FiscalYearOctToSep,
(month(calendarDate) + 2) % 12 + 1 as FiscalMonthOctToSep,
case
when month(calendarDate) >= 7 then year(calendarDate) + 1
else year(calendarDate)
end as FiscalYearJulToJun,
(month(calendarDate) + 5) % 12 + 1 as FiscalMonthJulToJun
from
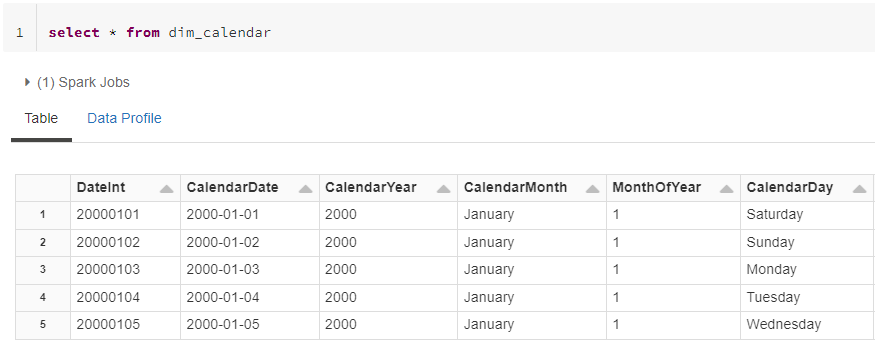
datesExamine the Calendar Dimension
Let’s examine the calendar dimension with simple query. The first few columns should look like this:
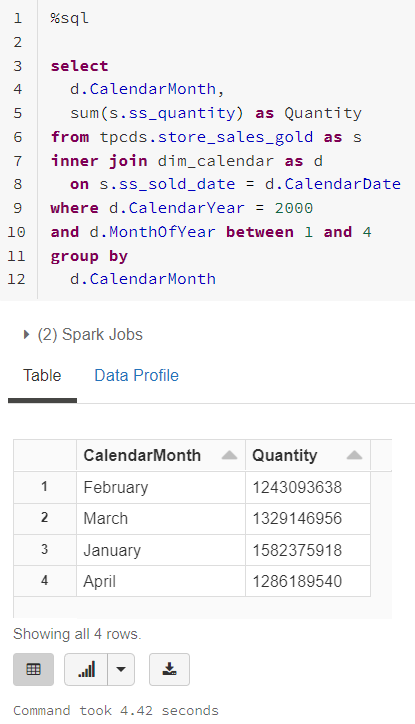
Now we have a calendar dimension in the data lake that can be used to query fact tables or used as a source for semantic models. As a test, let’s perform a Spark SQL query that aggregates sales data by month. I like using robust datasets for tests, so I’m going to query a 2.75 billion row version of store_sales from the TPC-DS benchmark.
Notice how we’re using a calendar dimension in the data lake just like we’ve done for ages in the data warehouse. If you’d like to generate a calendar dimension in your own environment, you can find the code in the calendar-dimension-spark repository.
The ability to create a calendar dimension in Spark allows for easy navigation of fact tables in the data lake. The benefits of this dimension will be obvious to data warehouse users and analysts – it can be reused across multiple analysis, it is scalable, and it is extremely user friendly.
3Cloud has strong experience in generating calendar dimensions in Spark. If you’re wondering how these tools could benefit your business outcomes, contact us today!


