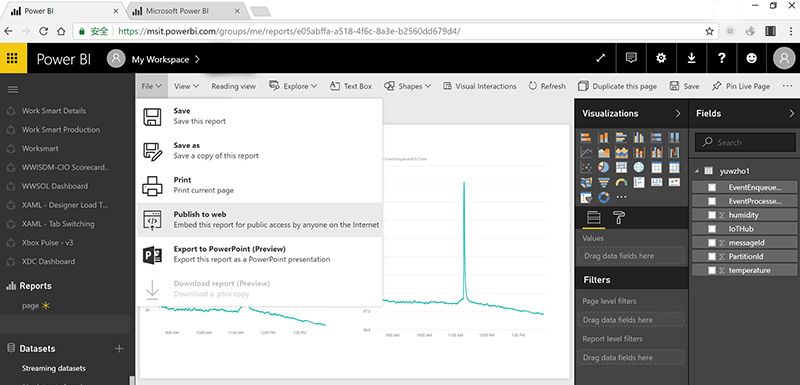
Have you ever stopped to think about how much time being an “excel ninja” takes? For many, this has been a way a life for years. What if there were an easier way to perform your analysis? Now, what if there were a way to not only easily perform data analysis but to also transfer your findings to an interactive, visually appealing PowerPoint deck? Insert Power BI!
Power BI enables end users to quickly and easily perform ad-hoc data analysis. It also gives users the ability to seamlessly embed full reports or report tiles into PowerPoint presentations, transforming your static deck into a fully interactive presentation experience. No more snipping tool or copy / paste necessary. With Power BI, you’re one PowerPoint add-in and a couple of clicks away from bringing sexy back!
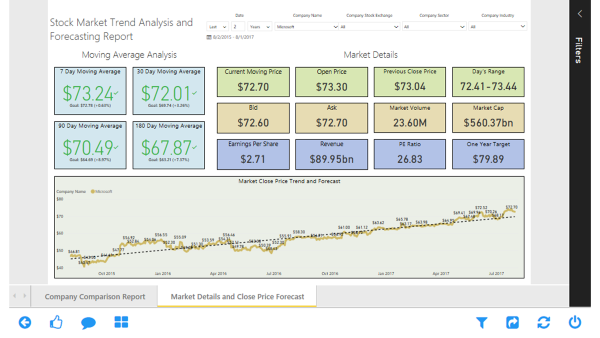
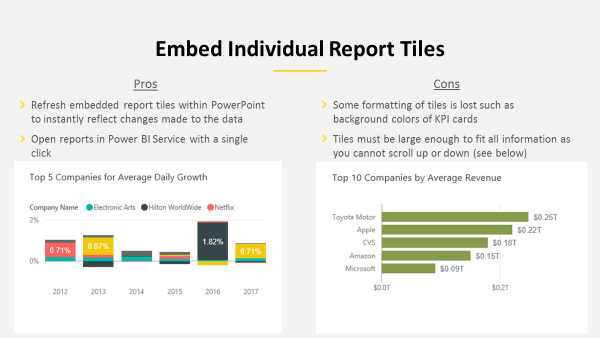
Instructions for Embedding Power BI into PowerPoint Decks:
Here’s a quick crash course on how to embed a report or report tiles from Power BI Service into your PowerPoint deck:
- Launch PowerPoint
- Navigate to “Insert” located on the top ribbon

- Navigate to “My Add-ins”

- Navigate to Store

- Search for “Power BI Tiles” and select “Add”

- Select “From Power BI”

- Log in the Office 365 account where your report exists
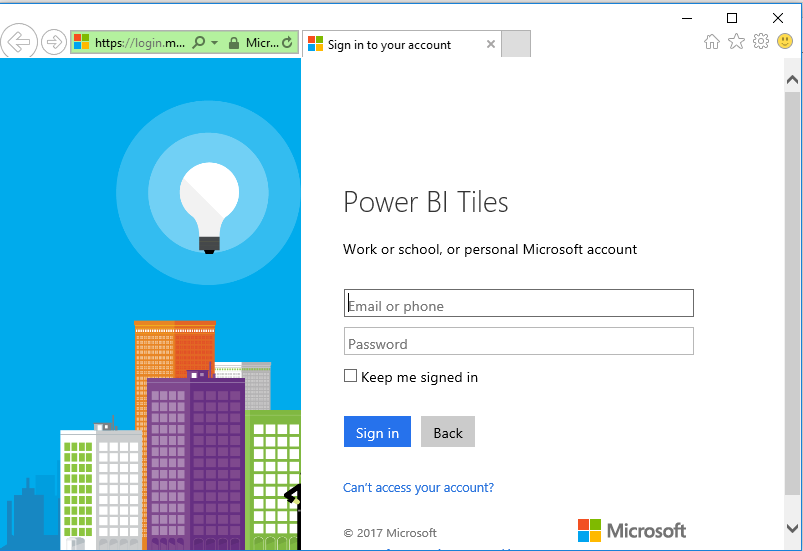
- Lastly, select a report from the”Reports ” tab or tiles from the “Dashboard” tab
- Dashboards that were created using a Live Pin of a report will not be displayed under the “Dashboard” tab, they will present under the “Reports” Tab

As you can see, Microsoft has made this process very straightforward. Even as simple as the process is, the ability to make your PowerPoint deck interactive will not only save you time but will also add value by enabling you to tell a better, more actionable story. For an example please find the supporting slide deck here.
Reach out to 3Cloud for more insight into adding Power BI into your business.


