
Whether you are looking for ways to derive business value from your data or you are simply searching to learn more about emerging analytical technologies, you will certainly have to navigate the vast world of technical acronyms.
Acronyms are supposed to make our lives easier when it comes to frequently referencing lengthy terms or complicated technologies. Their purpose is to abbreviate technical jargon so that we can effortlessly use it in day-to-day conversations with our colleagues or peers. However, with such a vast number of acronyms dominating the data and analytics space, it can be a daunting experience to continuously research and effectively utilize these abbreviations.
If we do not understand the terminology behind the letters in these common acronyms, then their intent to make our business interactions simpler quickly becomes irrelevant. Here are the top 15 acronyms you need to know when interacting in the data and analytics field:
- BI/BI&A = Business Intelligence/Business Intelligence & Analytics – Data by itself is meaningless. This refers to the process of identifying, organizing, and presenting data in a way that enables organizations to leverage information to make crucial business decisions. The desire to increase revenue, decrease costs, improve efficiencies, reduce risks, and expand opportunities drives the continued investment in BI&A as companies realize the insights locked within their data.
- EIM = Enterprise Information Management – This embodies the process of developing, implementing, and regulating necessary policies and practices to govern and enhance the value of data and information assets. Through data integration and warehousing, organizations can centrally store and manage their data in a useful way for continued access and analysis.
- EDA = Exploratory Data Analysis – This specifies an approach to examining a dataset with the objective of better understanding some of the relationships and characteristics present in the data before any transformations are made. It is the process of analyzing, summarizing, and often visualizing a dataset to gain familiarity with the data you are working with.
- ODS = Operational Data Store – This serves as a centralized database that facilitates access to a preview of the current data from various transactional systems into one location for efficient operational reporting. The advantage here is the ability to integrate multiple sources of data into one destination for decision making or evaluation of controls.
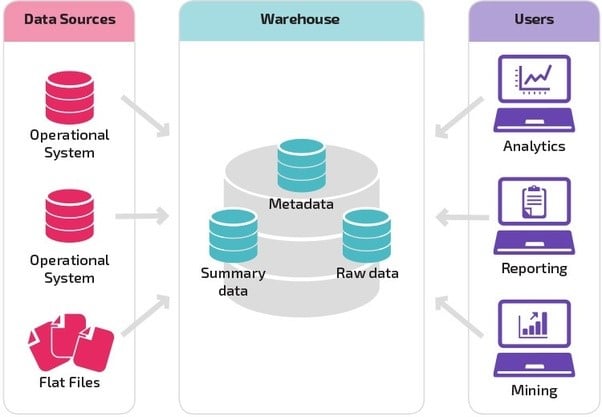
- EDW = Enterprise Data Warehouse – This serves as the central repository of all data for an organization. It integrates information from multiple sources into one or several databases. The benefit is that it stores historical and current data in one location that can be accessed for analysis and reporting.
- SQL = Structured Query Language – This is the language of all data. It is the method through which we can interact with a database for effectively storing, retrieving, and manipulating data. SQL performs many types of queries to transform large collections of data into a manageable, useful form of information.
- OLAP vs. OLTP = Online Analytical Processing vs. Online Transaction Processing – Similar looking terms with an important distinction: OLAP describes the process of analyzing data with complex queries to help make informed business decisions. Users can aggregate data from multiple database sources at the same time. In contrast, OLTP refers to the act of processing the day-to-day transactions of an organization through capturing and storing data in real-time. Think: OLAP = data analysis, whereas OLTP = data processing.
- ML = Machine Learning – This is a technique used by computer algorithms to generate models that improve with experience and many iterations. Also known as predictive analytics, algorithms are trained on sample data and forecast several possible outputs without being explicitly programmed. These models are evaluated on various metrics, such as accuracy of prediction and speed.
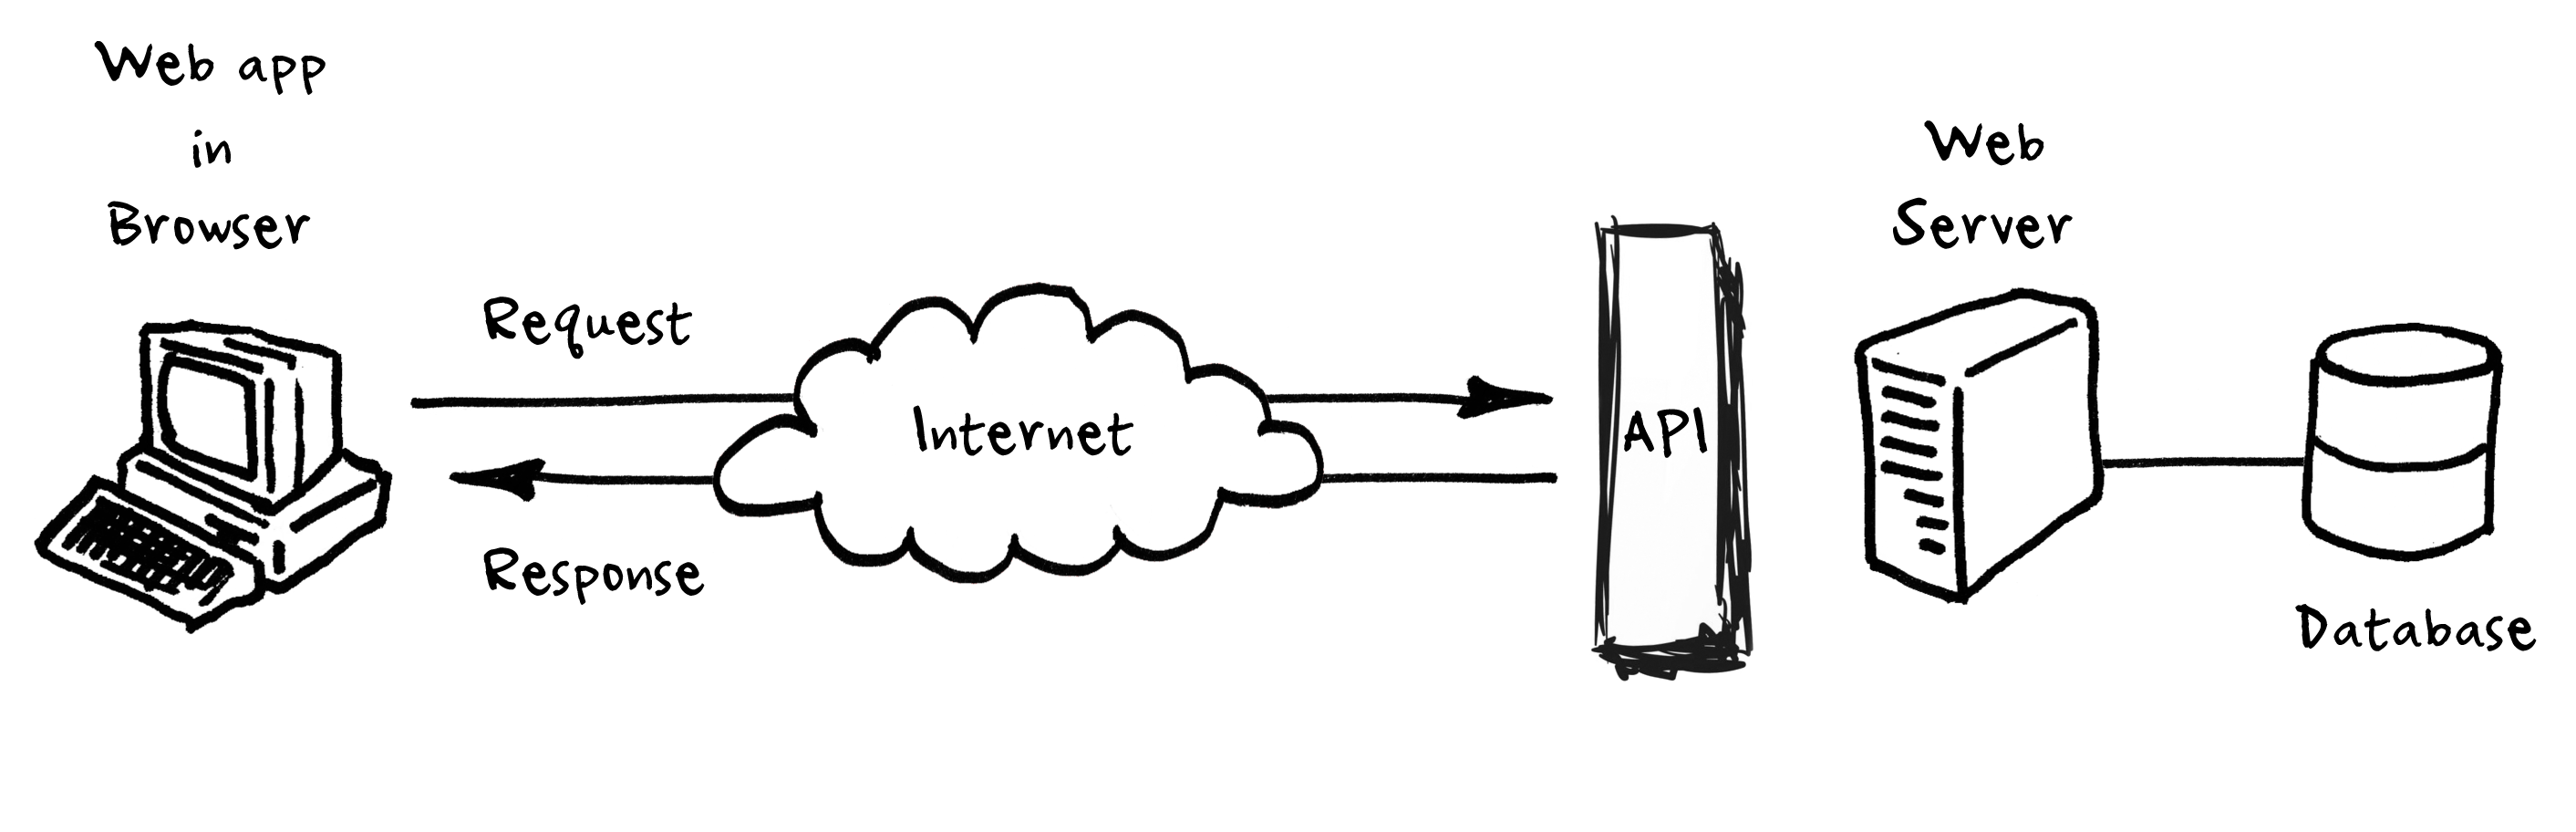
- API = Application Programming Interface – This fancy-sounding set of functions is responsible for making data transmission possible in various ways. It is programming code that enables software products to exchange and access data from one another. Through calls and requests, we can send and receive information between multiple destinations with the appropriate data conventions and formats.
- MVP vs. MLP = Minimum Viable Product vs. Minimum Lovable Product – Related terms with a meaningful difference: an MVP is created with a minimal monetary and time cost to evaluate the functionality of an item. The purpose is to understand the needs of the user and the practicality of the item. However, an MLP emphasizes the design aspect, such as capabilities users appreciate and features that they admire. The focus is to make the item enjoyable to use. Both instances are not final products and are subject to new iterations.
- NLP = Natural Language Processing – This defines the ability of software to recognize, understand, and manipulate natural languages, such as speech and text. The purpose is to eliminate the gap between human communication and the ability for computers to comprehend and generate accurate, useful output.
- OCR = Optical Character Recognition – This refers to the ability of computer software to identify handwritten or printed text characters within a document or image. It is commonly used for transitioning texts to be easily searched and edited. By recognizing patterns and detecting distinguishing features, OCR examines text and converts it into code that can be processed.
- POC = Proof of Concept – This is a tool used to demonstrate and prove that a specific model, prototype or experiment is successful in achieving the desired outcome and providing value to the business. It verifies the potential of a previous idea and is referenced as evidence of a feasible solution. The goal is to implement and adopt the POC on a larger, more detailed scale through ongoing engagements.
- UX vs. UI = User Experience vs. User Interface – Two highly interrelated terms here: UX cites the involvement and participation a user has with certain products or services. It highlights the interaction individuals have with various components and features. On the other hand, UI specifies the particular platform or environment that users encounter. It focuses on the asset with which individuals come into contact. These terms are commonly used when discussing a customer’s or user’s digital experience, such as website visits or interactions with metrics and data visualizations on a dashboard.

- KPI = Key Performance Indicator – This is a metric that organizations use to quantify their success in a specific aspect of their business. It is important that KPIs are clearly defined, communicated regularly within the organization, and are frequently updated to accurately reflect the most recent status. These quantifiable measures reveal progress towards objectives and opportunities for improvement.
Keeping up with the Ever-growing Data & Analytics Jargon
The ever-growing library of data and analytics acronyms can be overwhelming, and it feels as if new additions are made daily. Hopefully, you can now recognize a few of these common acronyms throughout your data and analytics journey.
Innovative technologies and processes, along with the terminologies associated with them, will continue to expand and evolve. This dynamic environment can be challenging to keep track of on your own. If you would like to better understand the value you can gain from your data, implement processes that will create helpful insights into your business decisions, or take advantage of the capabilities of analytical technologies, 3Cloud is here to help guide you through your next data and analytics initiative.


