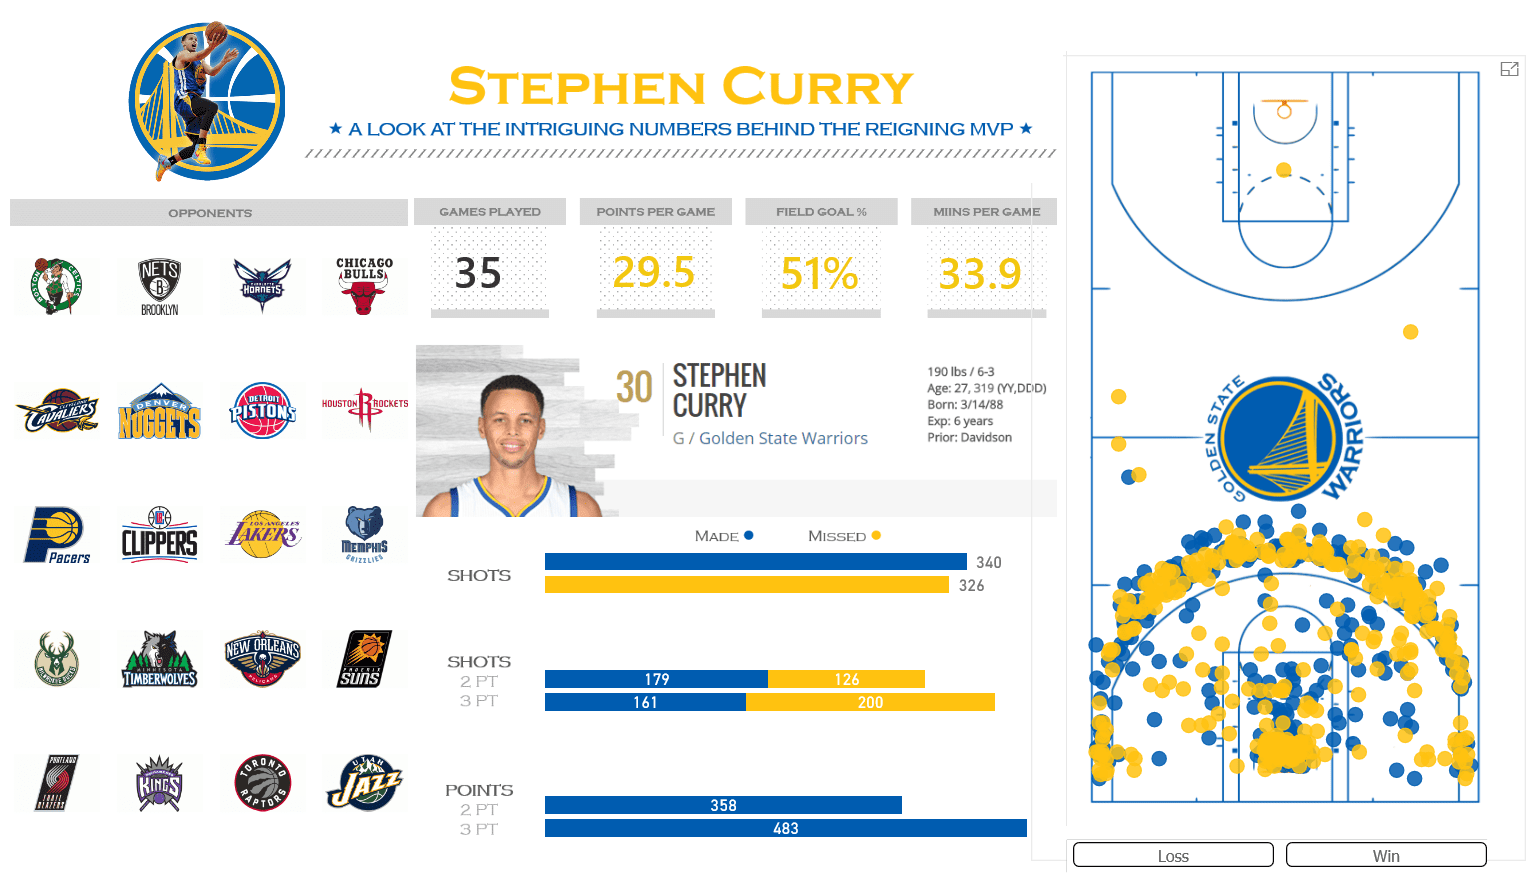
Microsoft recently held a Power BI Best Report Contest, and we are proud to announce that BlueGranite’s Senior Consultant, Jason Thomas, took first place! Congratulations to Jason for his excellent work!
To date, Microsoft has held two Power BI competitions, and BlueGranite is in the unique position among Microsoft partners to have had employees win prizes in both. In fact, in the latest contest, two of the Top Ten finalists were from BlueGranite. After a period of public voting, Jason won overall with his creative look at basketball data.
Unlike the Best Visual Contest last October, which focused on coding and chart design (and where a BlueGranite employee took third prize), Jason’s goal for the current Best Report Contest was to design content that told a story about his data. Although all ten of the finalists had creative entries, Jason’s report stood out for his combination of superb design and technical expertise.
Power BI Creativity and Innovation
Let’s take a look at the intriguing report behind the reigning Power BI MVP. There are a few aspects to Jason’s story that I wanted to highlight:
- Subject Matter
Jason designed his report’s story around shot statistics for Stephen Curry, the NBA’s 2015 MVP. While the typical use for Power BI is for business data, the choice of basketball data shows how Power BI can be extended for other purposes. This is an entertaining use of Power BI and highlights how the software is a capable tool for broader data visualization. It is not simply another business application.
- Innovation
The report stands out for its use of layered visuals. Jason showcased his Power BI talent by combining images with charts. Most noticeably, this occurs with the display of shot locations overlaid on the basketball court. The team logos also stand out. Other combinations are subtle but add great value to the final theme, such as the use of a grey dotted grid under some of the numbers.
- Design
Looking at the report, you would have no indication from the theme that this is a report that was created in Power BI. The design is polished, and it does not contain any of the default colors that typically identify Power BI content. Jason did not try to place too much content on a single page. He also humbly incorporated feedback from a few colleagues. It shows the care and attention that he paid to his overall design, and the report stands out as a result.
Below is a live version of Jason’s report, or view it full screen here:
New Power BI Functionality – Publish to Web
What made this contest and showcase possible? Microsoft ran its Best Report Contest in conjunction with a new Publish to Web feature. This allows anyone to embed a Power BI report into a website without requiring a login to view the content. In addition, for private company data, the Power BI team also released functionality to directly share a report to users outside of your organization.
Why is this new functionality important? You are now free to build reports in Power BI and distribute your content to a wider audience. As web capabilities have grown, we have progressed from static visualizations to interactive ones online. If you read news articles or see other types of posts, these often include the ability to interact directly with a report to enhance your experience or tell a better story. Or, perhaps you simply need to share a report privately with your prospects or clients. Whether it is to enhance your brand, for customer service, or for any other use, you can put your content more easily in front of external viewers.
This combination of direct sharing and publishing to the web opens up numerous possibilities for Power BI. As an example, BlueGranite recently published a portfolio of reports in Microsoft’s Partner Showcase. Interact live with our sample reports for Finance, Healthcare, and Retail. We’re excited to help our clients utilize these new capabilities!
Is your organization deploying Microsoft Power BI?
BlueGranite offers hands-on, instructor-led training at your facility to help both business and IT teams adopt Microsoft Power BI for self-service business intelligence and analytics. Up to ten attendees will receive expert-led guidance through a complete set of hands-on labs and training modules. After the training, attendees will be able to acquire data, build data models, and create visualizations quickly and easily with Microsoft Power BI. Click here to learn more.


