
Introduction
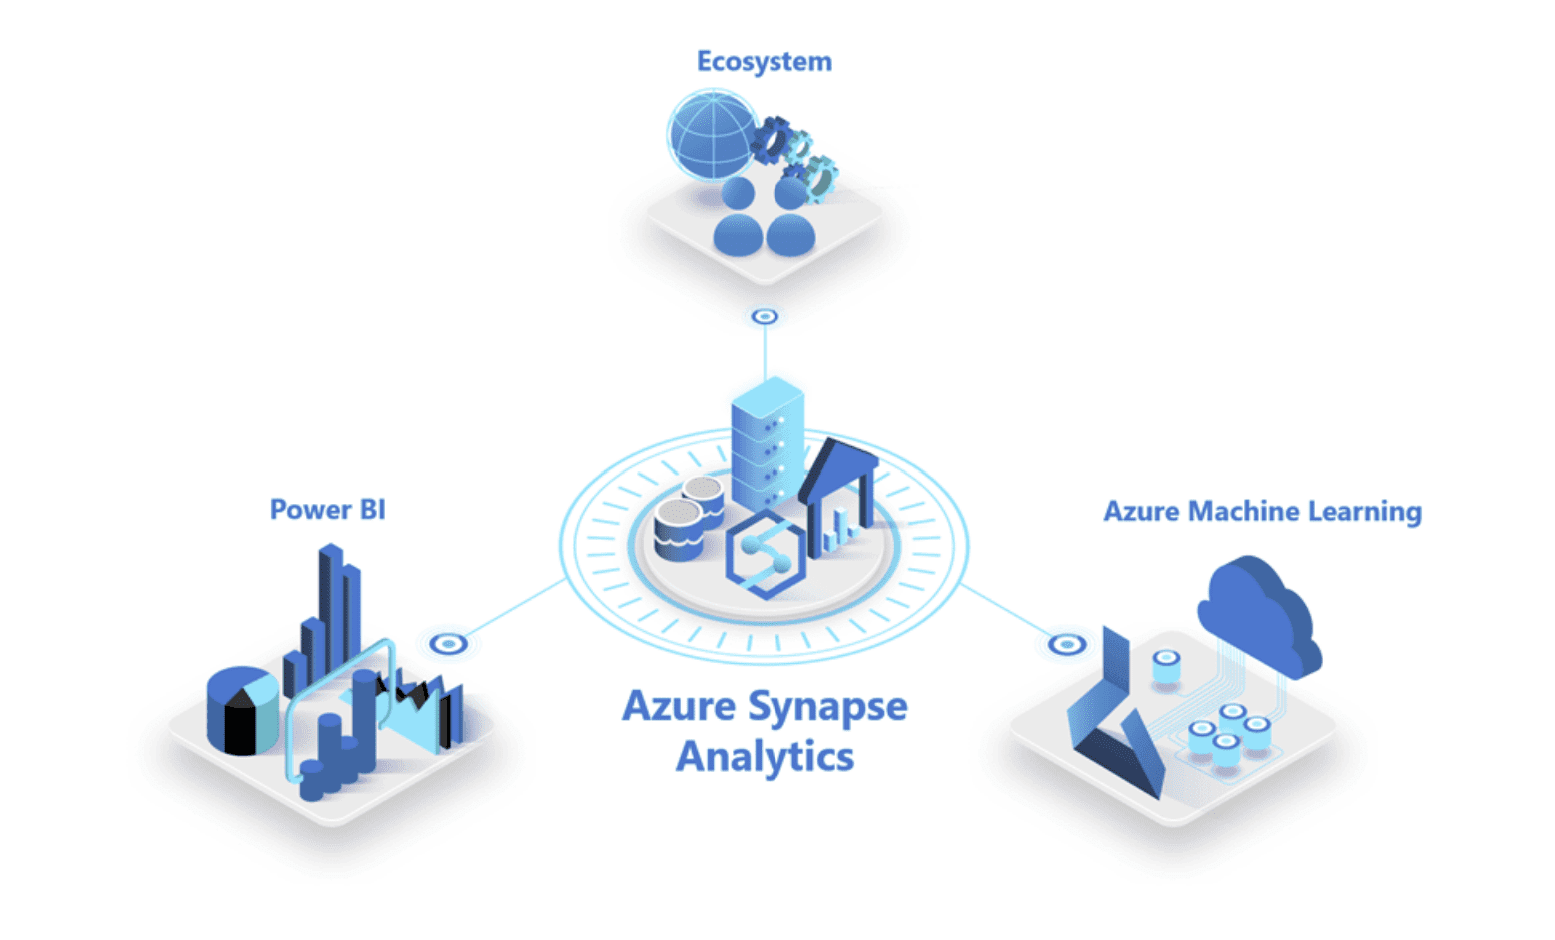
Combining the forces of Azure Synapse Analytics and Microsoft Power BI allows you to tie together your organization’s full lifecycle of data ingestion, transformation, and visualization. Users no longer need to manage a variety of technologies to achieve their reporting needs. Synapse encompasses the traditional processes of data warehousing, cleansing, and visualizing all within Synapse Studio, fostering unity among teams and driving efficiency across organizations.
Why Use Synapse for Reporting?
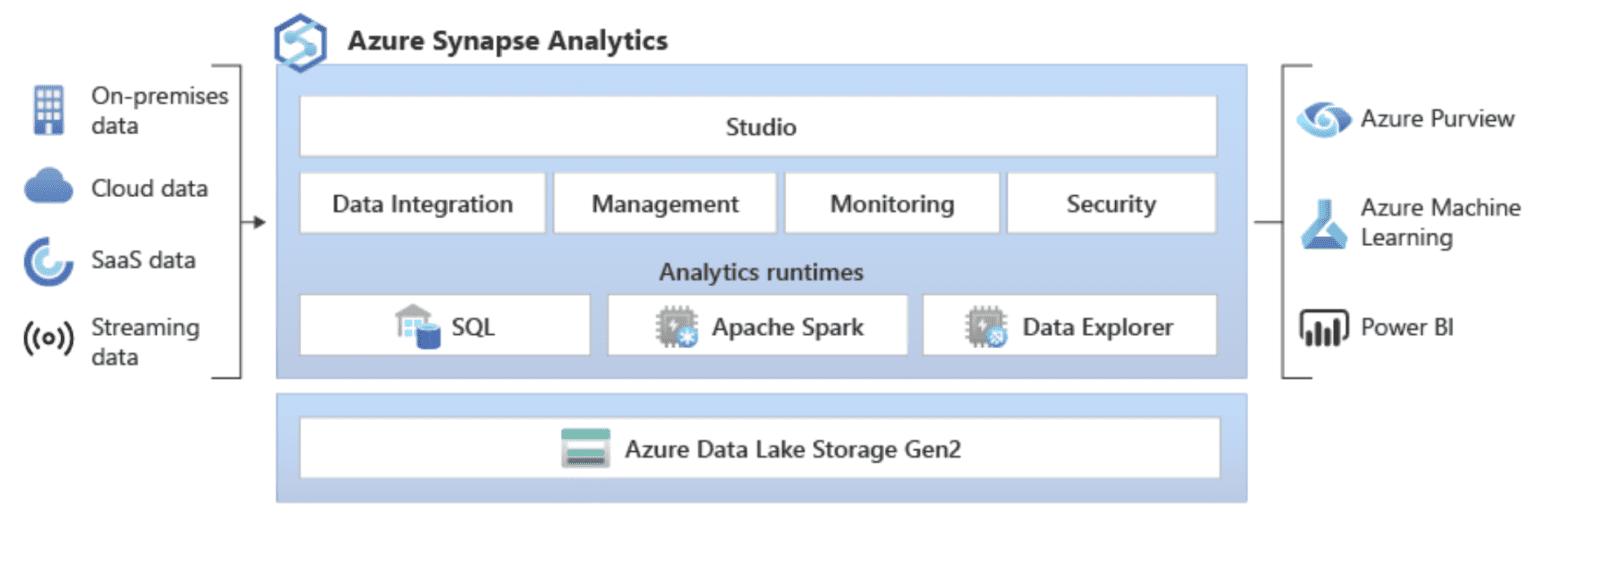
Synapse operates through the cloud, utilizing massively parallel processing to query petabytes worth of data. Users can use Linked Services in Azure Synapse Analytics to connect to hundreds of available data sources, such as Azure Data Lake Gen 2, through serverless or dedicated SQL pools. The true power of using Linked Services is that users can query data directly in Synapse without having to load the data into Synapse Studio itself – Synapse directly calls the source. This means that users can query millions, or even billions, of rows and receive results within minutes. Further, users can make complex calculations, aggregations, and group by statements that would be cumbersome and expensive to perform otherwise.
However, Synapse can also host massive amounts of data. By creating Synapse or Azure Data Factory pipelines, you can load directly into Synapse. Since Synapse is an Azure resource, it is fully managed by Microsoft, which frees users from worrying about service outages or network latency. Synapse’s flexible cloud structure also means that users can scale their workloads as business needs evolve – this is a key advantage over other data transformation and loading technologies.
Additionally, the data can come from either relational or non-relational sources, or from cloud or on-premises sources. Since Synapse can host such large amounts of data, data can be stored at the most granular level available; users can then create views tailored for reporting purposes. Organizations can create solutions to house their entire analytic solution in a single area. Synapse lightens the burden of troubleshooting failures or query errors by creating a single location for the entire data lifecycle.
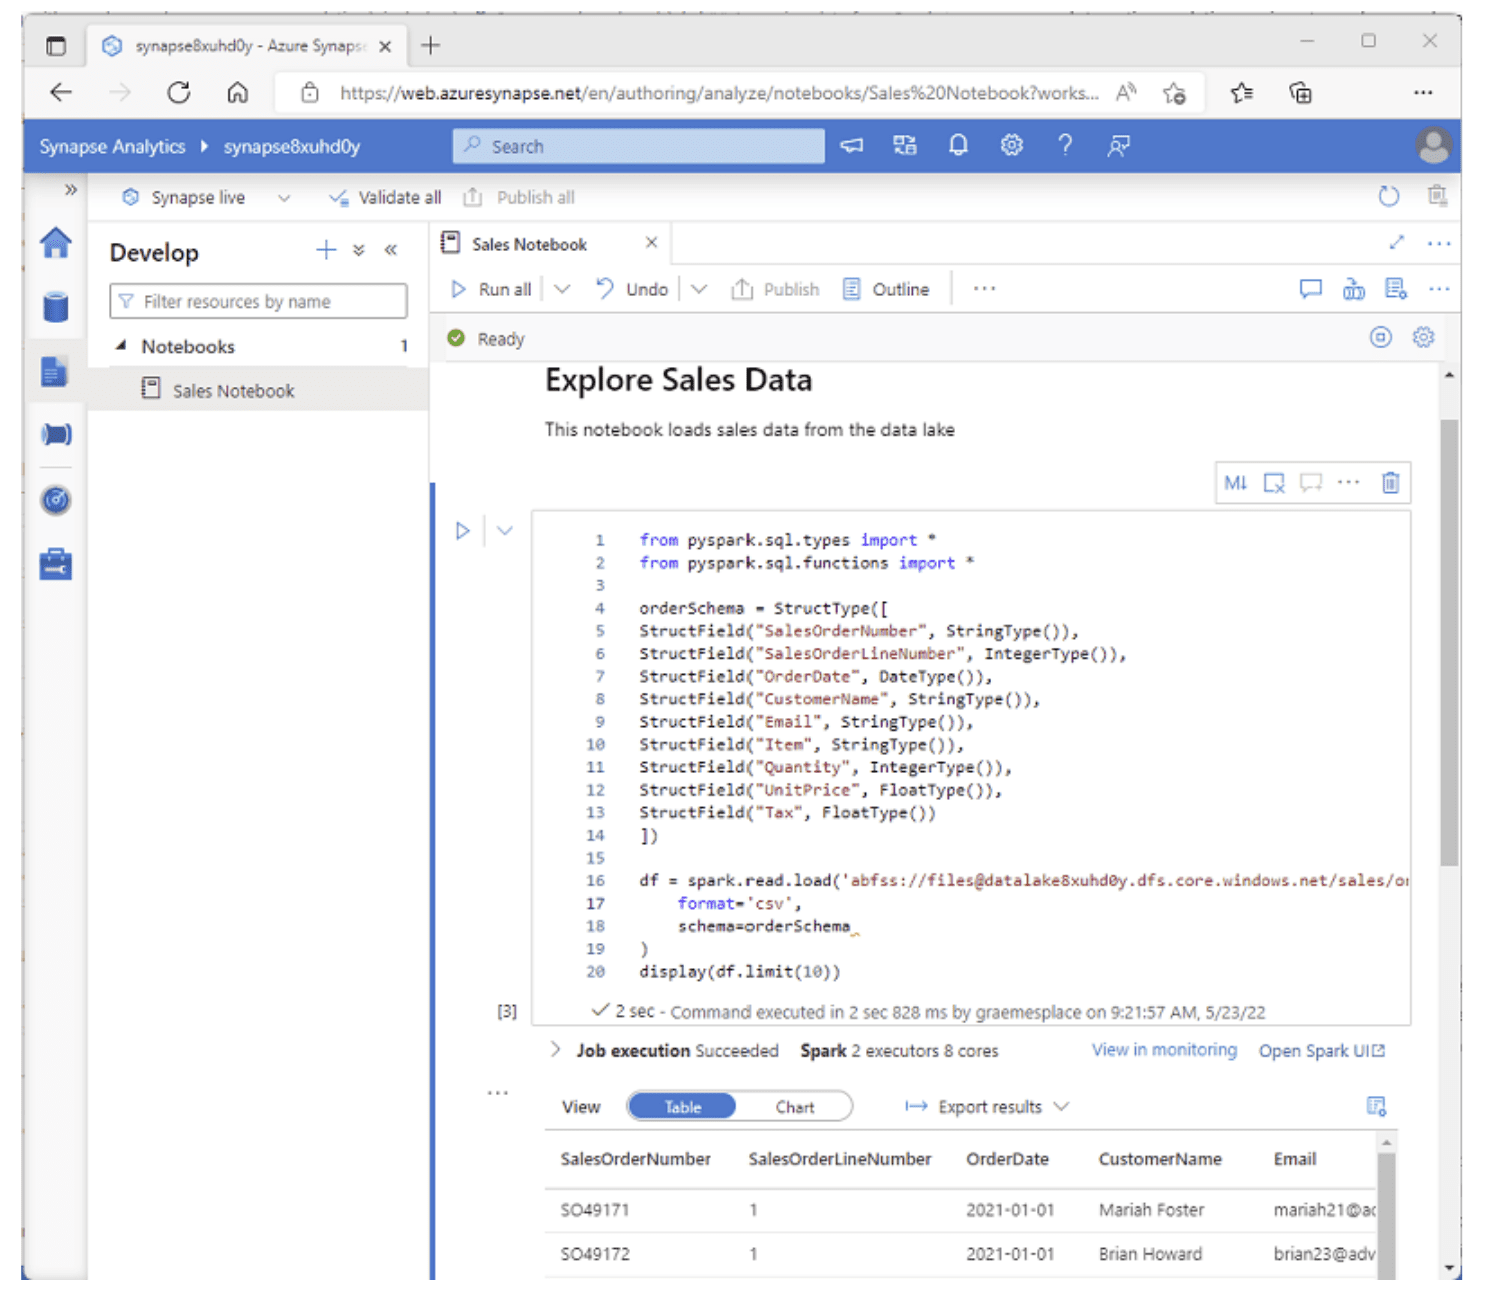
Synapse Studio’s interactive notebooks offer a user-friendly interface for exploring the data. Users have the flexibility to query and transform the data using SQL, T-SQL, or Spark, meaning that users can draw upon their existing wealth of databasing and querying knowledge to work with the data. Further, Synapse notebooks support data in a variety of formats, ranging from raw formats like CSV or JSON files, to processed files like Parquet or Delta Lake files, to traditional tabular files like SQL files. The simplistic user interface empowers users to view query results in near-real time, ultimately saving time to development.
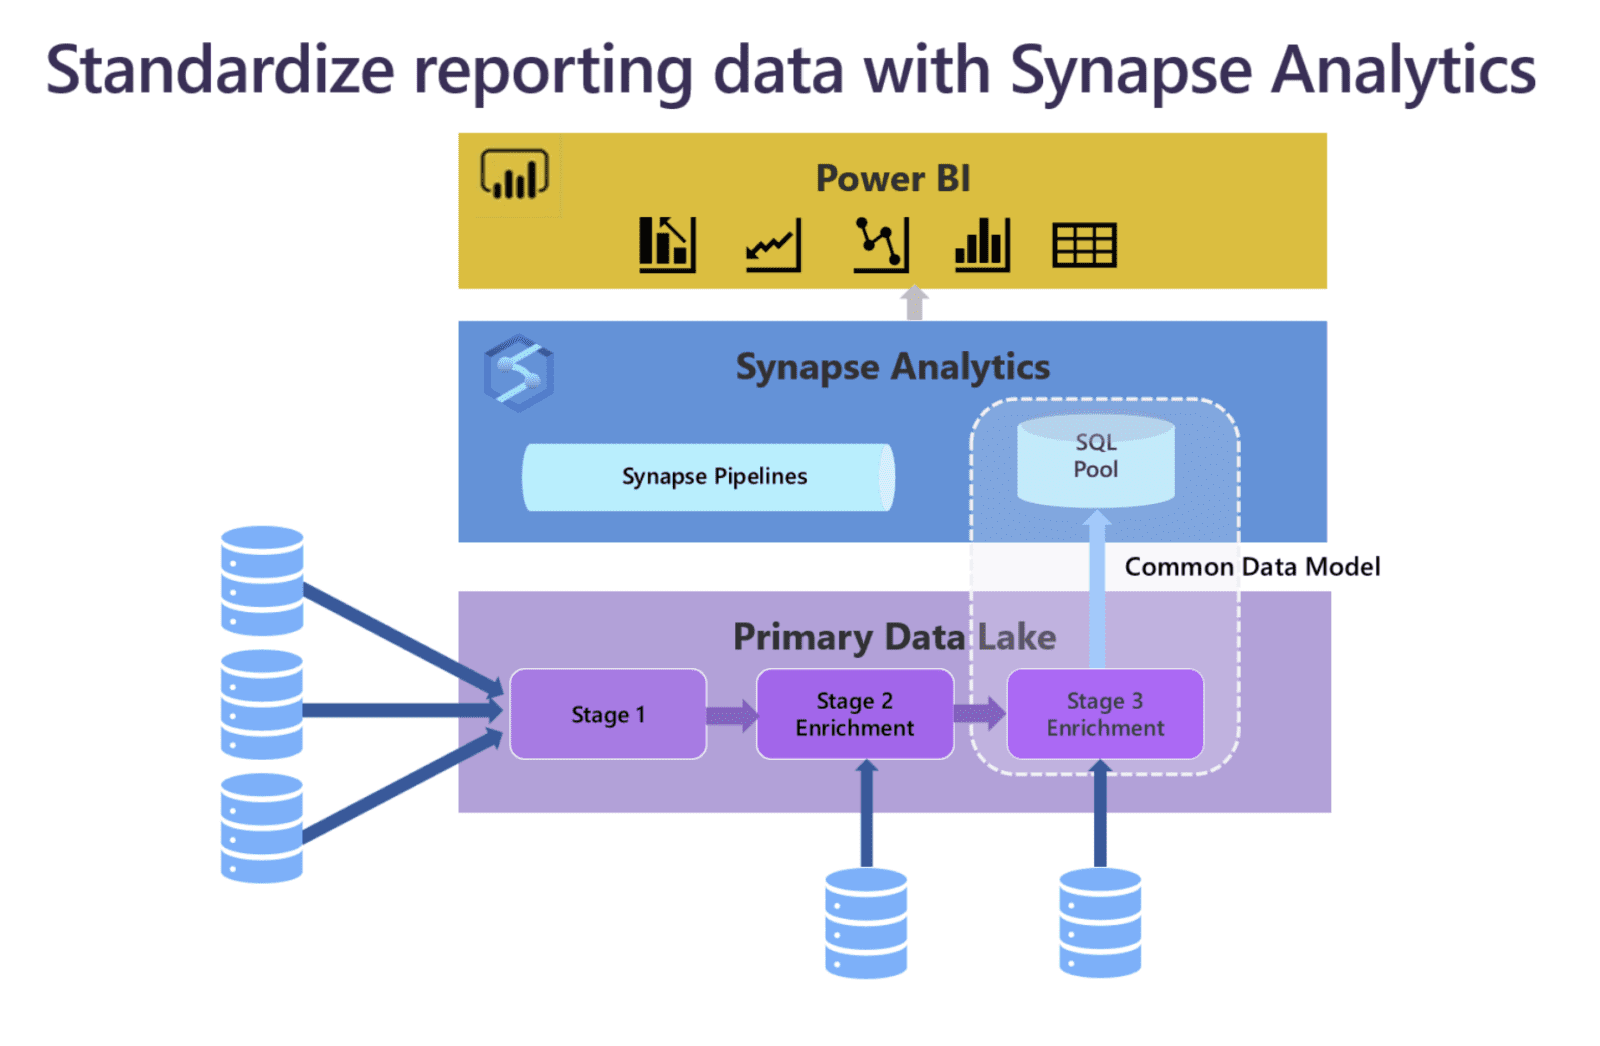
After exploring the available data, users can transform and shape their data using Synapse Pipelines and Dataflows within Synapse Studio. Here, users can format, clean, and shape the raw data to fit any reporting requirements. This is especially important if you are connecting to unstructured data. Developers can create materialized views that contain summarized subsets of the data relevant to the reporting audience, boosting query performance down the line.
Top 5 Integration Use Cases
The key is that there is a remarkable amount of flexibility with how you integrate the two technologies. There are several different ways Power BI and Synapse can work together.
Dataset Refresh Automation
Perhaps the most powerful scenario is using Azure Synapse to automate the refresh of datasets in Power BI. After loading and transforming data in Synapse pipelines, users can then schedule the refresh of a Power BI dataset. This creates a truly end-to-end scenario, ensuring that reporting data is always consistent and aligned across the organization.
Advanced Data Exploration
The two services are the perfect solution for big data enterprises. For example, an organization may bolster massive amounts of data consisting of different data types. The organization may choose to use Synapse to ingest and transform their data to leverage Synapse’s enhanced compute capabilities. By using the interactive web experience of Azure Synapse Studio, users can easily explore their data and pinpoint exact transformations that need to occur. Performing the necessary data transformations to make sense of the different data types could be time-consuming and cumbersome using other technologies that do not have the same impressive compute power of Synapse’s Apache Spark engine.
Reusing Existing Transformation Processes
Another example scenario would be if an organization already has existing data transformation and integration processes in place using another Microsoft technology. Synapse directly integrates with other data ingestion technologies, such as Cosmos DB, SQL, Synapse, Databricks, Event Hubs, and Stream. The organization could maintain their existing ETL or ELT processes and use Synapse as a landing point for the data, since Synapse can handle large volumes of data. Additionally, exploring the data in Synapse Studio could reveal further transformations that need to be made. Users could then make those changes directly in Synapse, without having to resort to another tool.
Enriched Data Testing Capabilities
Quality assurance testing is a breeze using both Synapse and Power BI. For example, a developer could utilize Synapse Studio to transform their data into a usable reporting format. The developer could create a simple Power BI report directly in Synapse Studio intended solely for the development process that is connected to the data being transformed. Then, the developer could see the results of the transformations in a clean, visual format without ever having to leave Synapse Studio. Visualizing the results of the data transformations using a dummy Power BI report can facilitate data exploration by bringing the numbers to life. Developers are encouraged to dive deeper than the surface level of reporting requirements and support sophisticated analyses of the data.
Unlocking Advanced Analytics
Synapse notebooks empower organizations to perform advanced analytics against data across the organization. For example, users can create notebooks that call the Power BI REST API to retrieve report usage metrics. From there, users can paint a detailed picture of report usage and activity across the organization. The data retrieved from the API exposes detailed metrics on how users interact with content in the workspace and who is accessing each resource. Developers can then leverage this information to enforce governance and ensure security of their data.
Usage Together
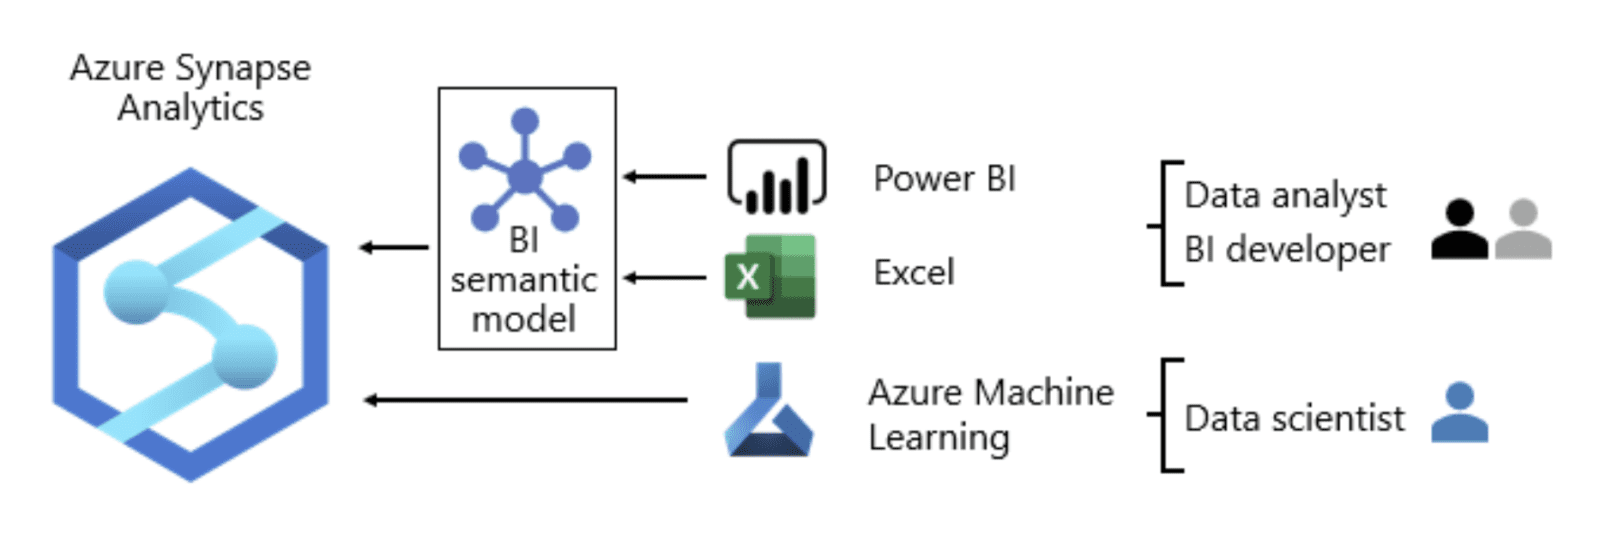
The benefits of combining the two technologies are endless. Tying the processes of transformation and visualization together fosters team unity and collaboration. No longer will development, report design, and data science teams exist on islands; Synapse and Power BI integration allows entire organizations to communicate more easily and work together in a secure central location. Easing the communication process allows the teams to keep the ultimate business goal in mind. Teams no longer need to spend time managing a plethora of separate systems to achieve their reporting goals. Further, Synapse’s powerful engine diminishes time to development. Teams can now focus on delivering valuable insights to their users.
In the next installment of this blog series, we will walk through a tutorial guiding you through the integration process.


