
As more and more organizations embrace data-driven decisions and the value of data democratization, their success in doing so will depend on getting their data management strategies right. For corporate and traditional Business Intelligence scenarios, many companies already have Master Data Management strategies in place. However, when it comes to self-service BI scenarios, there is often no real strategy and end users are left with gaping holes in their data quality as the usage increases over time. Let’s discuss how you can enable data democratization within your organization, as well as provide a tool for your power users to maintain data quality in their reports.

Missing the relevant master data information for the transaction data is a common data quality scenario. Here, I’ll walk you through how to identify, get notified, and resolve this. We will use Power BI to identify the issue and display in a dashboard, Flow to notify the data steward or subject matter expert of potential issues, and PowerApps to easily resolve the issue.
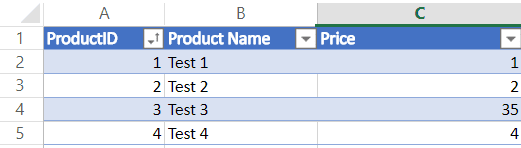
In this example, we have some product-related information (master data) stored in an Excel sheet in OneDrive for Business:
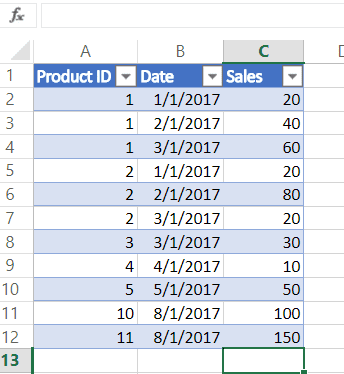
The transaction data is also stored in an Excel sheet in OneDrive for Business:
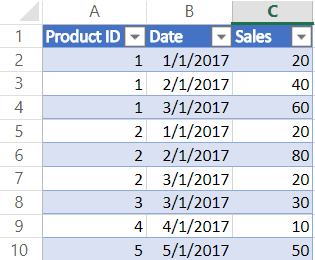
You’ll notice that Product ID – 5 is not present in the master data for Product. Follow the steps below to recreate the solution.
Step 1
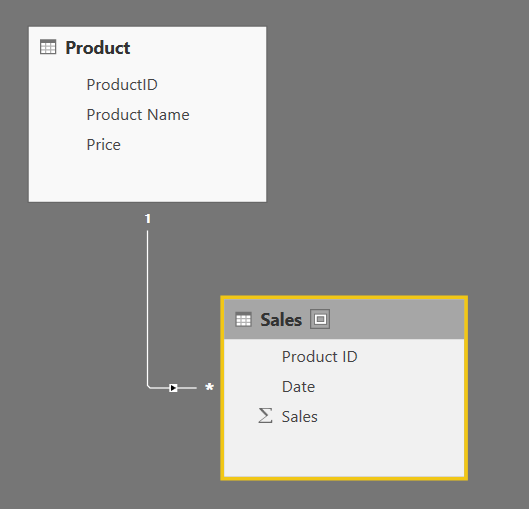
Create a Power BI report that displays the number of Product IDs in the transaction table that is missing the master data information. The model is straightforward for this scenario and you can even connect Power BI directly to the Excel files stored in OneDrive for Business.
Step 2
The next step is to create a DAX measure that will display the number of Product IDs present within the Sales table and not present in the Product table.
MissingProductID =
VAR MPD =
DISTINCTCOUNT ( Sales[Product ID] )
– CALCULATE ( DISTINCTCOUNT ( ‘Product'[ProductID] ), Sales )
RETURN
IF ( MPD > 0, MPD )
Step 3
Now, follow the steps below to create a simple Power BI report:
- Using the measure MissingProductID, create a card to display the total number of missing product IDs.
- You will need to create a table to display the missing product IDs. To do this, add a table visual using the Product ID from the Sales table and the MissingProductID measure.
- Additionally, you will need one table to display the data as it would appear for an end user. Create the table (just like step b) using the Product ID from the Product table and the Sales table. Lastly, add in the MissingProductID.
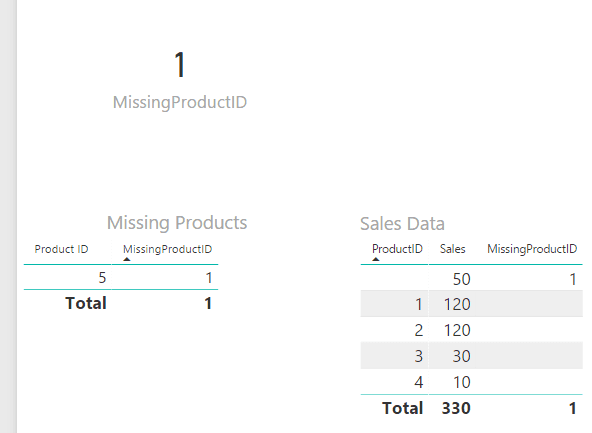
We can now see that there is one missing product ID (number 5). You can also see that the sales attributed to the missing product ID are 50 dollars.
Step 4
You will now need to publish this report online and pin the card you just created to a new dashboard. Set a data alert on the card (if you aren’t sure how to do this, read this article on setting data alerts in Power BI) with the condition (threshold above 0) and frequency (at most once an hour) as shown below. Emails are not enabled as we will make use of Flow for that. Click on Save and close.
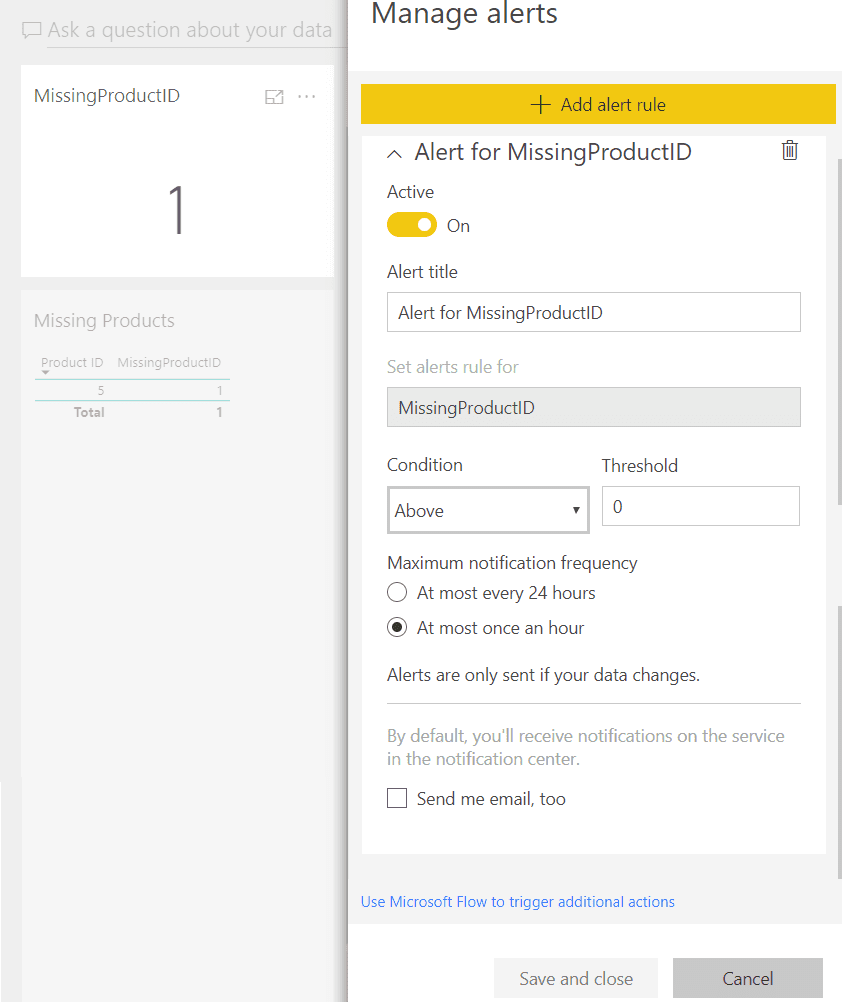
Step 5
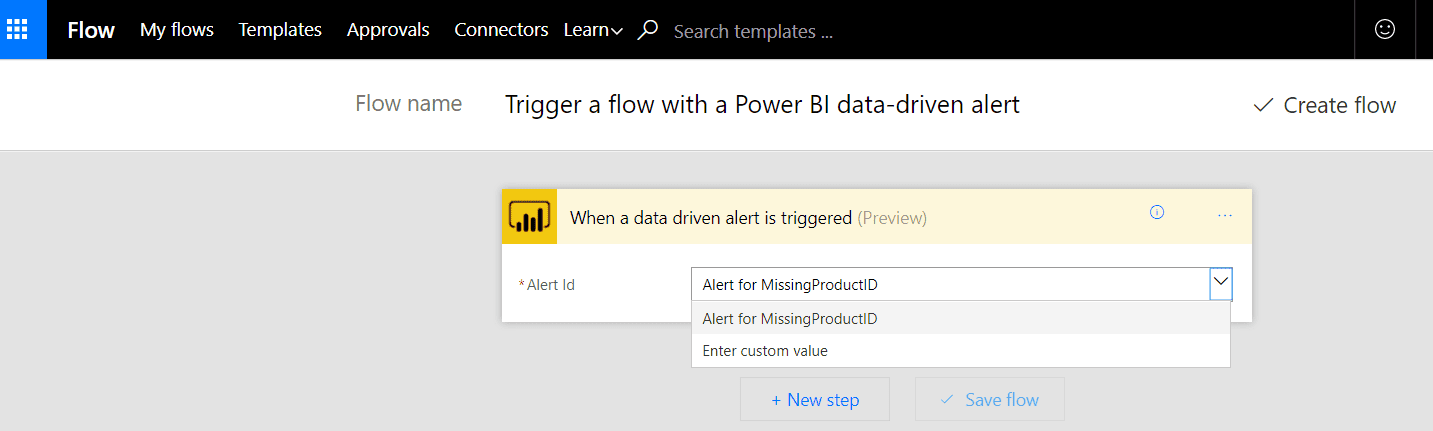
For the next step, go back to Manage Alerts (found under the ellipsis icon of the card on which we set the data alerts) and select the alert that we just made (shown below). Click on “Use Microsoft Flow to trigger additional actions” found at the bottom of the alert. This will take you to Microsoft Flow and will open a template for triggering Flow with Power BI data-driven alerts. Select the alert we just created:
Step 6
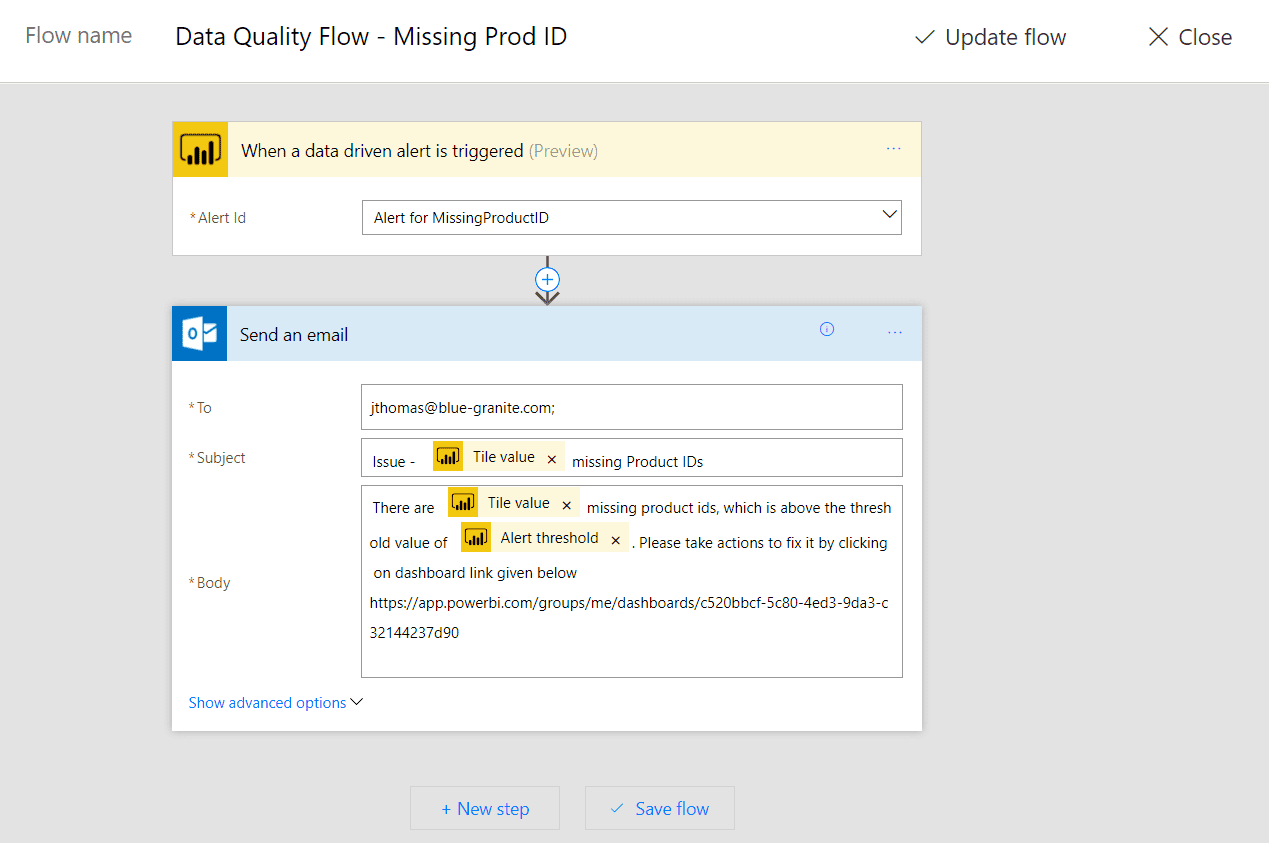
Create a new step which will be an action to send an email, and add some content in the subject and the body of the email draft. Note that we are providing the link of the dashboard in the body of the email:
Step 7
So far, we have used Power BI to identify the issue and Flow to notify the power user of the issue with customized email content (rather than the generic data alert message from Power BI). Our next step is to make use of PowerApps to create an App that can help the power user make the required corrections or add missing product IDs in the Product Excel file.
To do this, log in to PowerApps with your username and password. Click on the Apps menu on the left, and select Create New. You should see the screen below where you can select OneDrive for Business as your data source.
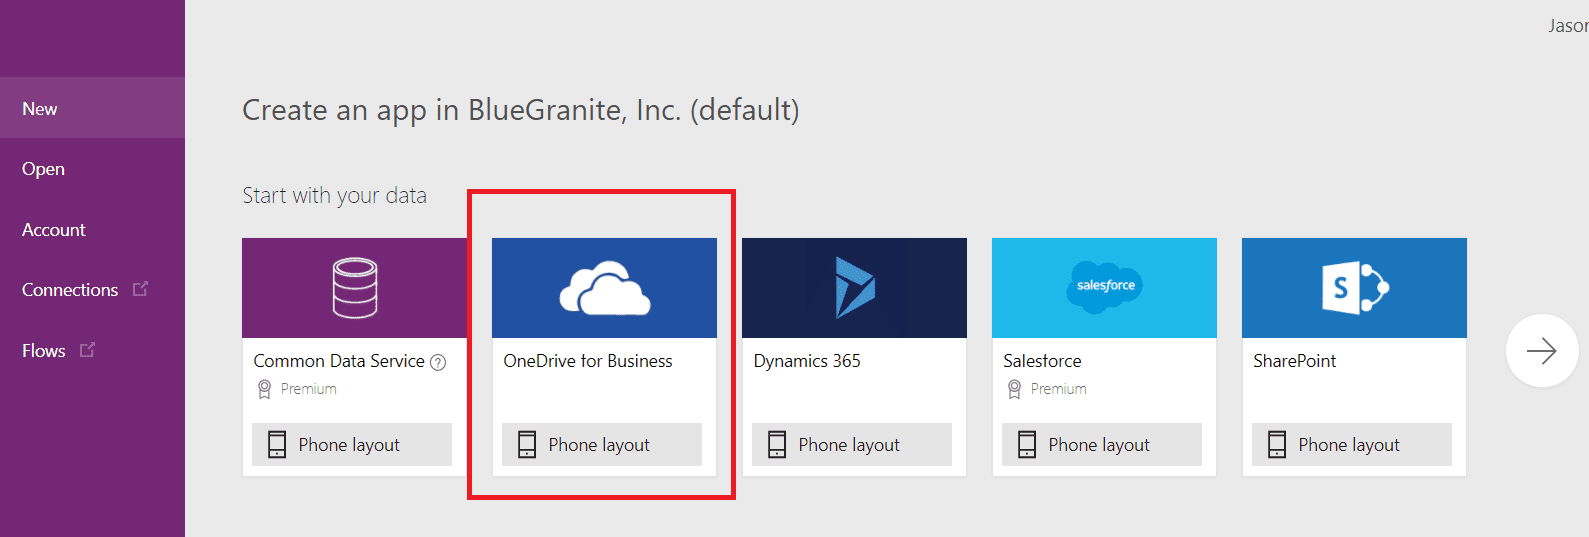
Add a new connection to OneDrive, point it to the Product.xlsx file, and choose the Product table as shown below:
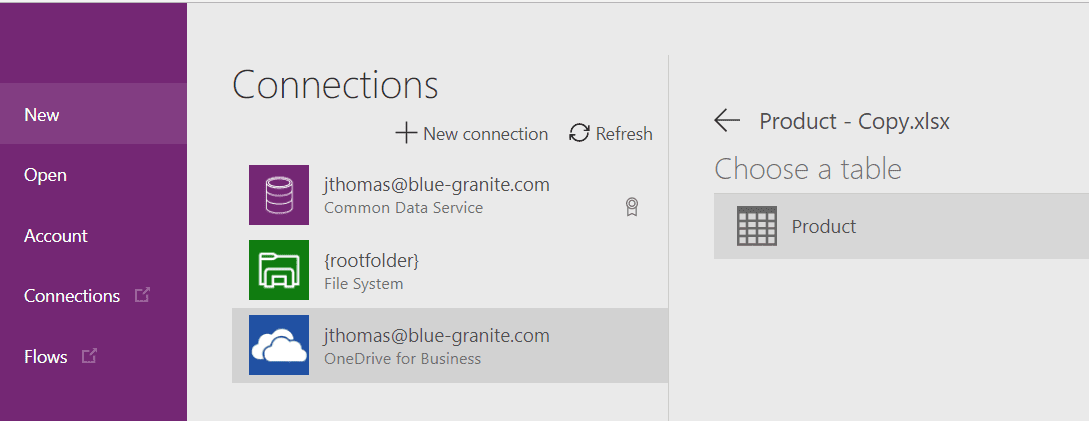
Click on the Connect button below after selecting the table, and your basic app should be ready in a few seconds.
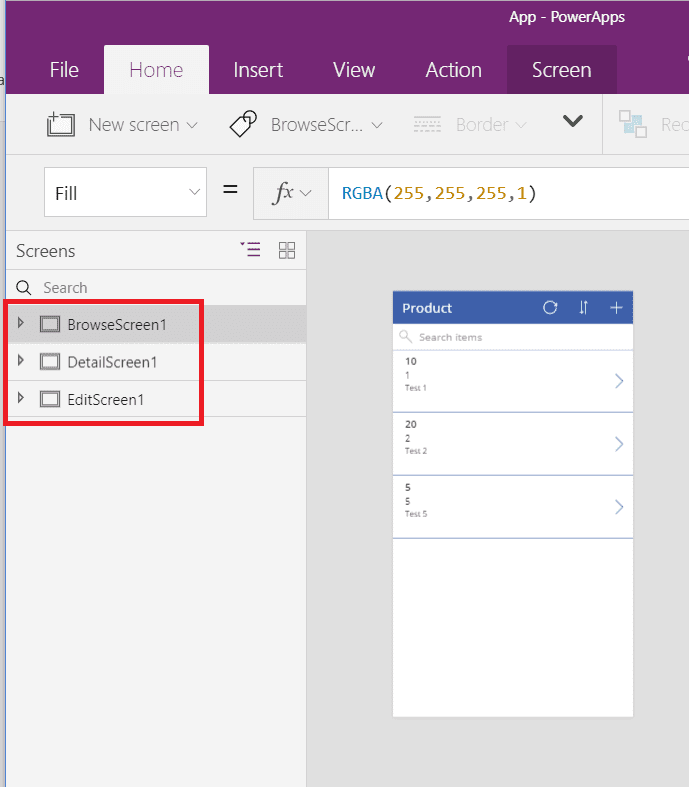
Step 8
You should see three screens in the app that you created –
- Browse screen – where you can see all the Product IDs and selected details
- Detail screen – to show further details of the selected Product ID
- Edit screen – where you can add or edit Product IDs
You can follow this link to learn how to edit this app further. For the purpose of this post, we are just going to use the basic app as it is.
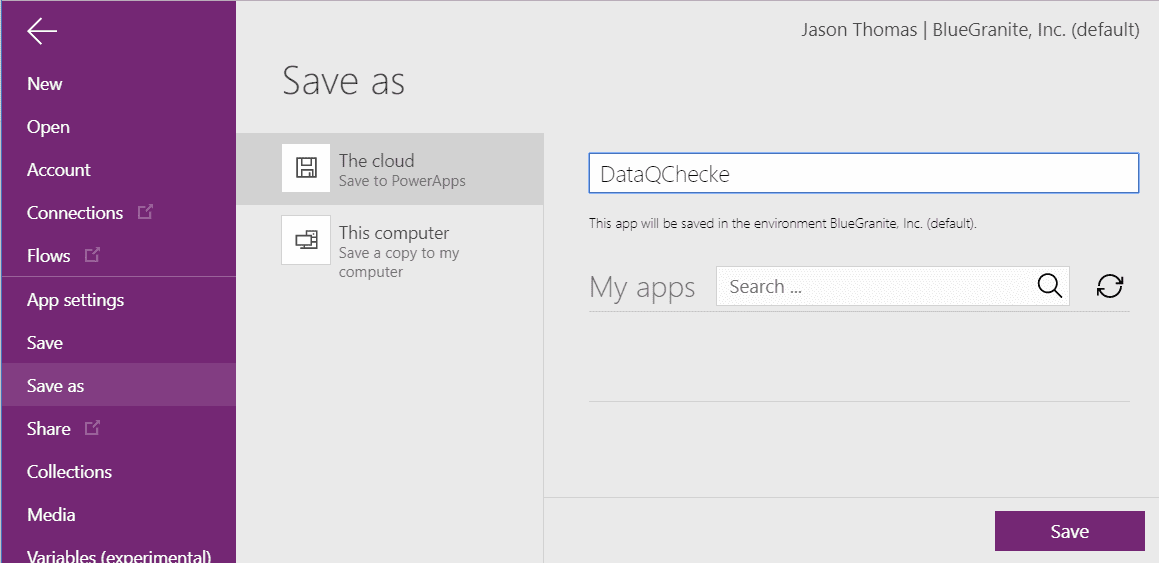
Step 9
Save the app to the cloud under the name DataQChecker:
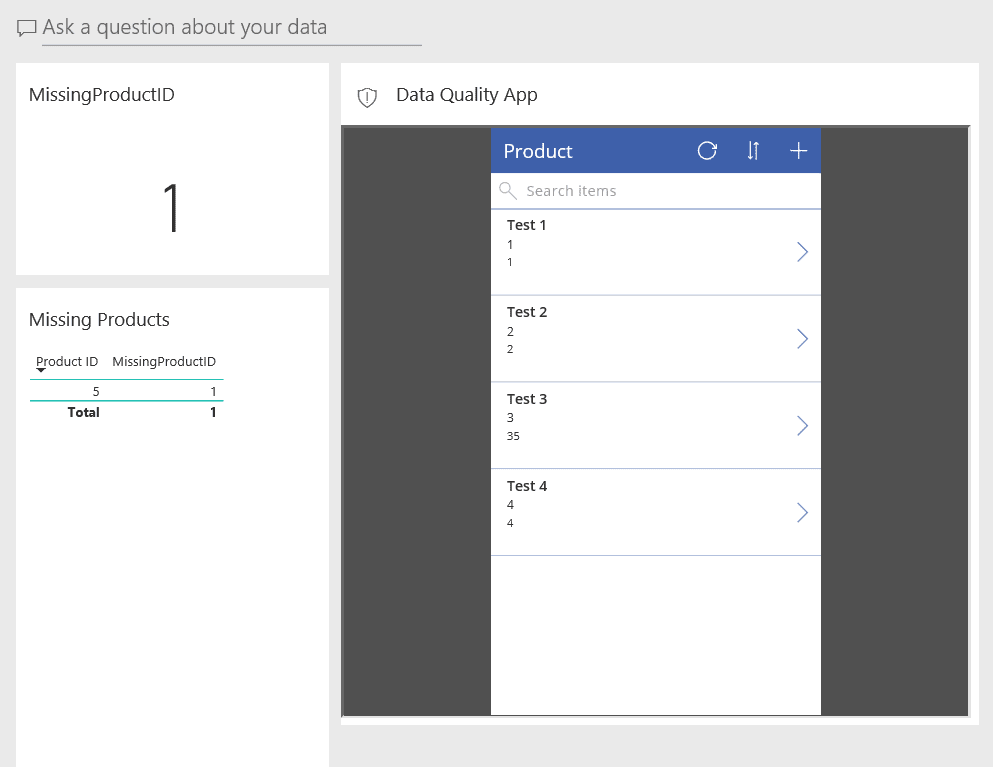
Step 10
After that, embed this app into the Power BI dashboard that we created using the steps from this article. Now your dashboard should look similar to the example below where you have an interface to directly add or edit product entries.
Step 11
In this step, we are going to simulate new data coming in by adding two more entries in the Sales table for Product IDs 10 and 11:
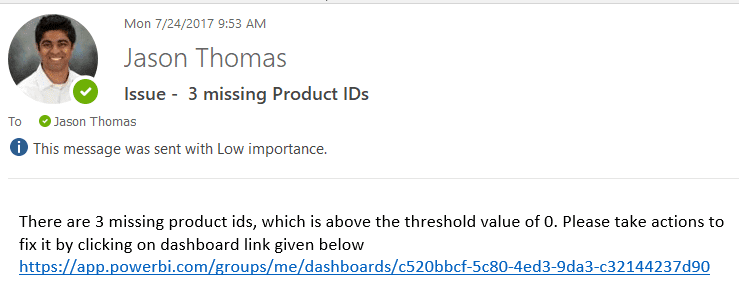
We know Product IDs 10 and 11 are not present in the Product table. Once the dataset is refreshed (could be a scheduled refresh or in this case, Excel files in OneDrive for Business can sync automatically), we should get an email as shown below:
By clicking on the dashboard link, we should see the dashboard with three missing product IDs:
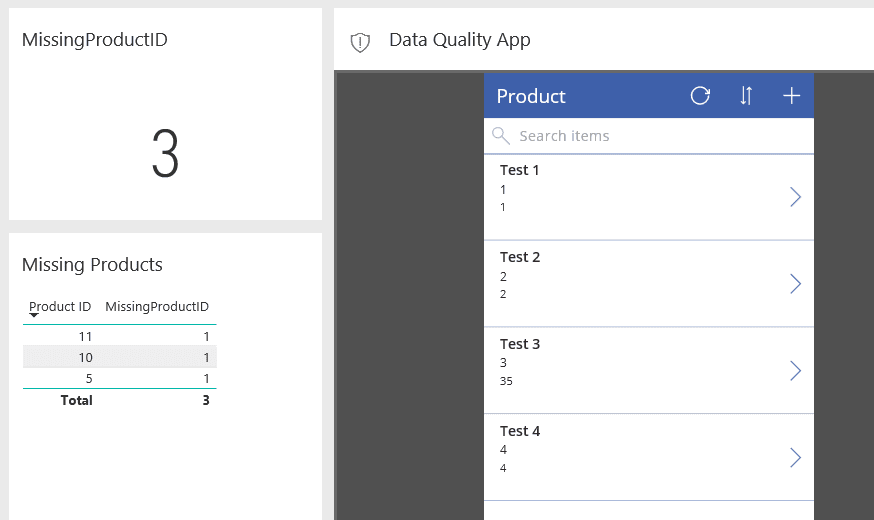
Step 12
Lastly, go ahead and add the three missing product IDs using the Data Quality App (right there in Power BI!). Refresh the dataset manually to see the results.
It really is that easy for self-service BI users to maintain the data quality of their analytics solution with the use of Power BI, Flow, and PowerApps. Maintaining data quality is vital to the success of the analytics solution as well as increasing adoption, and Microsoft provides all the tools required.
For a more detailed look at Microsoft Flow alerts, check out this post from Nathaniel Schrar: From Alerts to Actions: Power BI Alerts and Microsoft Flow. If you have questions or want to learn more about how to maintain your data quality, please contact us.


