
Often the data we have is not enough. Many organizations rely solely on internal data sources because it is simply easy to collect or part of their normal operations. Hospitals track care events for billing, universities monitor enrollment numbers for budgeting, retail stores use point of sales data for inventory management. These are undoubtedly important metrics for decision making, but it’s worth reflecting on whether internal data alone is enough for a business to stay competitive.
I will demonstrate how anonymized mobile phone data can be used to gain key insights into customer behavior. With Costco as a case study, I will share how shoppers to the retail chain changed their behavior amid the onset of the COVID-19 pandemic by providing three key insights: changes in foot traffic, dwelling time and related brands.

The Data Source
The data in this demo comes from SafeGraph, a San Francisco-based company that estimates foot traffic to over six million points of interest across the United States and Canada. Their location data has been used to evaluate diverse areas, like hurricane evacuation behavior [1], the impact of Starbucks’s open bathroom policy [2] and estimating COVID-19 risk by business type [3]. Specifically, I will use their Patterns dataset from 520 Costco retailers in the U.S from January 2nd to March 31st, 2020.
Insight 1: Visit Fluctuations
This dataset includes daily foot traffic to each store for an anonymized subset of customers. For example, look my local Costco in Kalamazoo, Michigan.
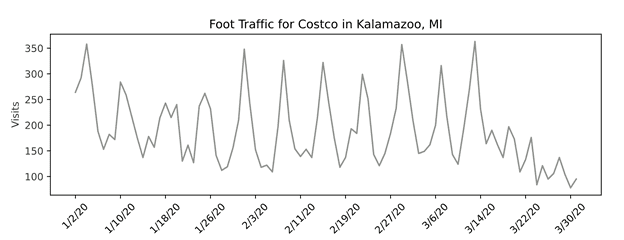
The first thing to notice is the weekly fluctuations in the number of visits with peaks on Saturdays and troughs on Tuesdays. The second item of interest is the overall number of visits, which is remarkably low for a Costco. I mean, think about it–this store fits so many customers that it has its own food court. In fact, the visit counts have been normalized, meaning a daily value can only be interpreted relative to other values.
I therefore choose to measure daily visits as the number of standard deviations from an individual store’s pre-COVID-19 average for that day of the week [4]. This has the advantage of showing whether a particular day and store is above or below the expected number of visits that day while allowing for cross-store comparisons.
A final observation with the above time series is how store visits taper off at the beginning of March. This corresponds with the beginning of the COVID-19 pandemic in the United States and following the first domestic death from the virus that occurred on February 29th [5]. Now I consider foot traffic to Costco stores nationally and introduce a measure of COVID-19 cases per 100,000 people [6].
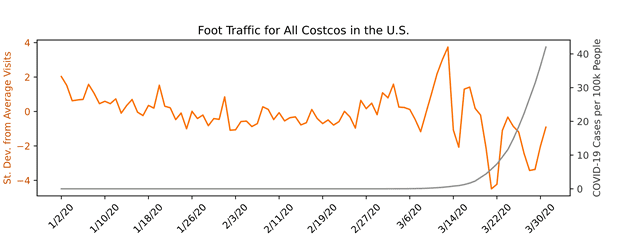
A striking, yet unsurprising, pattern emerges. We see only mild fluctuations from average visits in the first two months of the year. But as soon as the number of COVID-19 cases begins to rise, there is a period of panic-buying where the number of store visits increases to nearly four standard deviations above the average! [7] Then around mid-March–when many governors began issuing shelter-in-place orders–visits dropped to four standard deviations below the average.
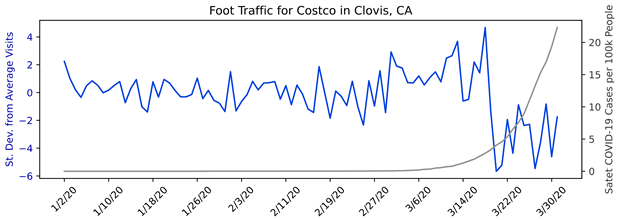
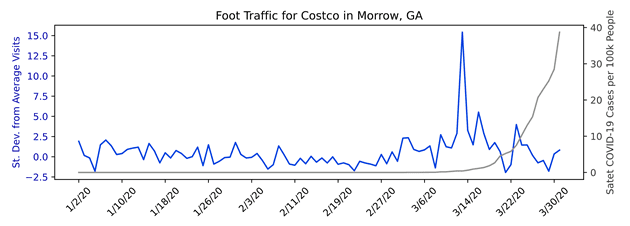
This national average for Costco however does not tell the entire story at the store level. Below are a few examples that show different patterns that emerge at individual stores where COVID-19 cases are now calculated at the state level. (Careful: the scales between graphs are not consistent.)
The diversity in foot traffic patterns reveals the differences between stores of the same brand. This reflects state-wide responses to the pandemic where on March 19th, California imposed shelter-in-place restrictions while Georgia did not.
Check out my video below that highlights more examples.
So why is this data important if a store already has measures of daily visitors from sales records? I see two use cases.
First, this data can be beneficial to estimate traffic at places where a store has no data. For example, Costco may want to know if there is a positive or negative relationship between the daily number of shoppers at its own locations and the nearby Walmart. Second, this data would be valuable to organizations without sales data, such as churches or schools.
Insight 2: Dwelling Time
There are additional insights in the shopping behavior of customers beyond whether or not they visited a store.
Costco Shopper Behavior by Month
| January | February | March | |
| Visits per visitor | 1.60 | 1.58 | 1.67 |
| Median distance from home (miles) | 6.38 | 6.35 | 6.20 |
| Median dwelling time (minutes) | 23.44 | 23.05 | 23.16 |
There seems to be modest changes in the month of March, albeit to varying degrees. The “visits per visitor” variable is a monthly measure of the number of visits divided by the number of unique visitors. This shows an increase at the onset of the pandemic, meaning that the rise in visits was slighter greater in returning customers than in new customers.
Another small change occurred in distance traveled from home, where the median visitor was coming from a shorter distance in March than the previous two months.
The third measure, median dwelling time, shows no meaningful change. One possible explanation is that there is a change in the distribution of dwelling times which is obscured when only considering averages. Since the dataset also shows bucketed values of dwelling time at the store-month level, I plot these below.
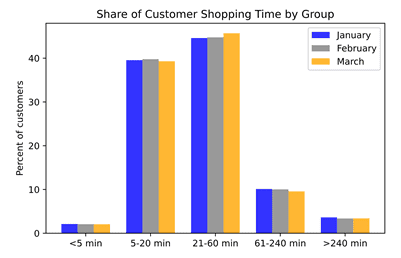
Visualizing these values by month tells a similar story about how there is no meaningful difference in time spent shopping. This is a surprising finding after observing such a large impact on foot traffic volume. It appears that the pandemic greatly affected the number of visits to Costco but not the time visitors spent in the store.
Insight 3: Related Same-Day Brands
The final insight I will discuss in the data is a measure of where other shoppers went on the same day as their Costco trip. The table below describes the top ten related brands, ranked in their respective month.
Top Ten Related Brands to Costco by Month
| Rank | January | February | March |
| 1 | Walmart | Walmart | Target |
| 2 | Target | Target | Sam’s Club |
| 3 | Kroger | WinCo Foods | WinCo Foods |
| 4 | Publix Super Markets | The Home Depot | Walmart |
| 5 | WinCo Foods | Starbucks | Kroger |
| 6 | Meijer | Kroger | Publix Super Markets |
| 7 | Starbucks | Fred Meyer | Meijer |
| 8 | Sam’s Club | King Soopers | The Home Depot |
| 9 | The Home Depot | Chick-fil-A | Safeway |
| 10 | Burger King | H-E-B | Starbucks |
Target, unexpectedly, rose to the top in March where relative to other months there were more than double the number of instances (not shown) it was identified as a related brand to Costco. We see also see March broadly having a greater emphasis on food stores with Sam’s Club rising to second on the list. Finally, there is less relative interest in fast food at the onset of the pandemic. January and February each have two fast food restaurants in their top ten while March only has one, and its last on the list.
Wrapping things up
We were able to gain an important understanding about Costco with just a three months of data available from a third-party provider. Companies, governments and nonprofits should not merely rely on their own, internal data for decision making. Data like that from SafeGraph allows organizations to see into areas that were once hidden from view.
Interested in learning more, please contact us today!
Footnotes and References
- Long, Elisa, M. Keith Chen, and Ryne Rohla. “Political Storms: Emergent Partisan Skepticism of Hurricane Risks.” Available at SSRN 3339723 (2019).
- https://www.forbes.com/sites/andriacheng/2019/11/12/starbucks-has-a-big-price-to-pay-for-its-open-bathroom-policy-study/#484919906c4a (accessed 7/21/20)
- https://www.nytimes.com/interactive/2020/05/06/opinion/coronavirus-us-reopen.html (accessed 7/23/20)
- Averages were calculated using visit counts for that day of the week from January 2nd through February 29th of 2020 for an individual store. Consider Mardi Gras, which was on February 25th, 2020. Here a value of -1 means the number of individual store visits was (on average) one standard deviation below each store’s Tuesday average.
- https://www.washingtonpost.com/health/first-us-coronavirus-death-prompts-new-travel-restrictions-from-trump/2020/02/29/4d492a7c-5b2b-11ea-9b35-def5a027d470_story.html (accessed 7/21/20)
- https://usafacts.org/visualizations/coronavirus-covid-19-spread-map/ (accessed 7/9/20)
- For reference, four standard deviations from the mean of a normal distribution corresponds to an approximate 1/30,000 event happening.


