
Technology has provided many methods to approach the question of customer satisfaction. For companies manufacturing products, there should be no surprise that reliability is an important factor for customers. However, before the customer’s perception of quality can be addressed, it is beneficial to obtain accurate insight into the product reliability.
This post is not going to quantify the relationship between customer satisfaction and reliability but instead focus on the key steps to analyze a product’s reliability. To get started, there are four steps that you can follow in determining the reliability for your product.
- Collect data
- Model the product life
- Estimate the distribution parameters for the product life model
- Estimate reliability
Collect Data
The data pertaining to failed and suspended (still working) units provides the basis for the analysis. The expected reliability can be gathered by running a sample of designed tests. In addition, collecting data on the product life of customer units will provide further insight and aid in detecting abnormal usage. With some planning and foresight a process can be established to capture the vital information.
Model the Product Life
This is a key step as the quality of decisions based on the estimated reliability pertain directly to the quality of the model. Of course the model is only as good as the data as Shane Risk explains in more detail. For those curious in the technical details, a common model used is the Weibull distribution as this model has the flexibility to address various characteristics of typical product failures.
Estimate the Distribution Parameters
With the model selected, the data collected should be fitted to determine the parameters for the model distribution. This can be done in various tools specific to statistical analysis, however the calculations can also be done in Excel or automated through a SQL Server Integration Services package.
Estimate Reliability
At this point the estimated reliability can be calculated and graphed. From here proactive decisions can be determined with greater insight and support. For example, the reliability graph below compares two versions of a product over the expected life in terms of cycles.
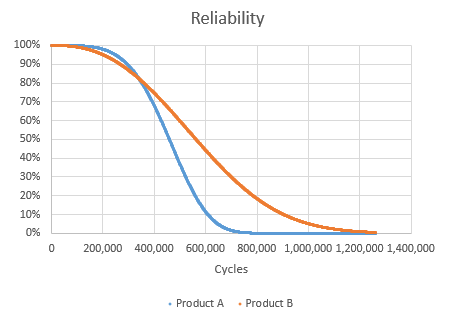
Obviously, forecasting reliability does not make a more reliable product in itself. However, the results can guide you through questions like: Is the problem a supplier issue, customer usage issue, or an expected failure? How long should warranty periods last for a product? When should preventative maintenance occur? With answers to these kinds of questions the root cause behind customer satisfaction (or dissatisfaction) can be establish.
Action Items
Key action items are to identify the critical questions you need to address and the benefit from those questions being answered. The critical questions will guide what data is required to formulate statistically supported answers. Keep following this blog for examples and further tips. Still have questions? Reach out to us so your analytics can transform from an idea to a model.


