
Yesterday Microsoft released a Public Power BI Preview for customers to evaluate new features in Power BI. This newly redesigned platform offers many familiar components, as well as some new and unique features. Which means you may be asking yourself what this new preview means to your current or prospective Self-Service BI initiative now that there’s an additional choice available.
The impact of the new Power BI Preview depends if you are already invested in Power BI for Office 365, and/or SharePoint, as well as your particular challenges and goals for usage of Power BI. Following are some of the meaningful changes to be aware of with respect to the Power BI Preview. Please note that this is accurate as of December 2014; as the product evolves the landscape will certainly change.
Direct Connectivity to Corporate Data with Row-Level Security
In the current Power BI for Office 365 environment, a base requirement is for the Excel file to contain the reports, the data model, as well as the data itself. This provides for a limited experience as most organizations are correct to be extremely cautious about creating many redundant copies of the data over many Excel files in order to support different reports, users, or authors. If you have an investment in Analysis Services Tabular models (i.e., the in-memory structure that is aligned with Power Pivot), then you will be delighted by this new capability to directly access the data and utilize row-level security on an individual user basis in Power BI. At this time, direct connectivity is only available via the new Power BI platform, and not via Power BI for Office 365.
Improve the Report Consumption Experience
A new style of dashboards allow a user to “pin” a visual to a personal page for at-a-glance monitoring. This permits viewing the most relevant charts, indicators, and data on a single page. This is a nice feature as it permits a single view across subject areas, and/or across separate reports. If you do not require a filtering experience for the pinned items, and you wish to offer users a personalized dashboard experience, this is worth investigating in the Power BI preview. There is currently no comparable experience in Power BI for Office 365.
Expand the Use of Interactive Data Visualization
The new Power BI Preview supports Power View as the visualization tool. Note that Excel-based reporting such as Pivot Tables, Pivot Charts, and Cube Formulas are not currently supported in the new Power BI Preview, nor is Reporting Services. If your requirements for presentation and interactivity can be satisfied with Power View, then you will be able to take advantage of some new visualization types just released (such as combo charts, treemaps, bullets, and funnels, among others). Due to the same underlying code base, some new visualization types available in the new Power BI Preview are available also in Power BI for Office 365.
New Authoring Environment
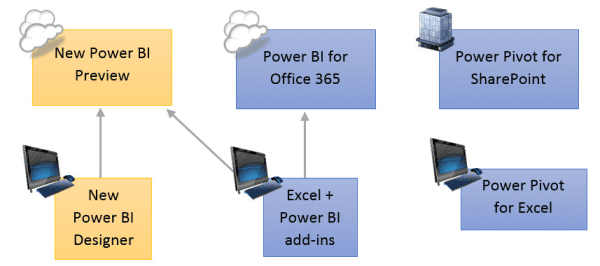
A new application called the Power BI Designer is available to design Power BI data/model/reports without the dependency on Excel. If you prefer to continue to utilize Excel as a design environment for Power Query/Power Pivot/Power View, then you may continue to do so in conjunction with Power BI within Office 365. However, if you prefer to separate the report design experience from the data modeling experience, or you don’t have the appropriate Power BI-compatible Excel version available to you, then the Power BI Designer companion application provides another viable option for authoring. By utilizing the new Power BI Designer (which is not compatible with Excel), you will be able to take advantage of new Power BI features as quickly as they can be released by the Power BI team.
Broaden and Ease Access to Data
Direct connectivity to various Sofware-as-a-Service applications, such as SalesForce, vastly reduces the effort required to access certain types of data. If you need to integrate SaaS data with other organizational data, then there’s no change to existing data integration processes. However, if you have a need to perform standalone analysis of SaaS data, the easy access and pre-built dashboards available in the new Power BI service can reduce time, effort, and complexity.
iPad Support
The new Power BI Preview includes an iPad application. Conversely, Power BI for Office 365 utilizes a Windows 8 application. Over time we will see more option for native Power BI applications. If you have mobile users who utilize iPad, then the new Power BI Preview may be of great interest.
Facilitate Developer Applications and Extensibility
If you have a need for APIs for programatically pushing or pulling data, you will be interested in checking out the APIs becoming available soon in the new Power BI platform.
At 3Cloud we are well-versed in delivering Self-Service BI solutions. We can help you navigate the ongoing changes and determine if the new Power BI service is the best fit, versus SharePoint on-premises, versus Power BI for Office 365.
Is your organization deploying Microsoft Power BI?
3Cloud offers hands-on, instructor-led training at your facility to help both business and IT teams adopt Microsoft Power BI for self-service business intelligence and analytics. Up to ten attendees will receive expert-led guidance through a complete set of hands-on labs and training modules. After the training, attendees will be able to acquire data, build data models, and create visualizations quickly and easily with Microsoft Power BI.


