
“Harness the power of AI through a truly unified approach to data analytics powered by Apache Spark.”
– Databricks, a unified analytics platform optimized for Azure
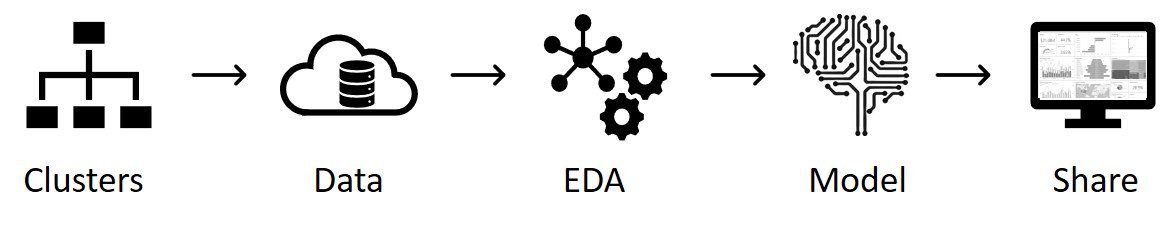
The mission of Azure Databricks is to make big data and AI simple by providing a single, notebook-oriented workspace environment that makes it easy for data scientists to create Spark clusters, ingest and explore data, build models, and share results with business stakeholders.

The analytic objective for this blog was to create a predictive employee turnover model. Traditionally, the steps for conducting such a task would require a fairly large collection of disconnected technologies and languages. However Azure Databricks offers an analytic workspace that allows for a seamless pipeline from ingestion to production. Thus, the technical objective for this blog was to test drive Azure Databricks and use an anonymized data set of HR employee information to build an employee flight-risk model.
Clusters: Spark power for processing large data sets
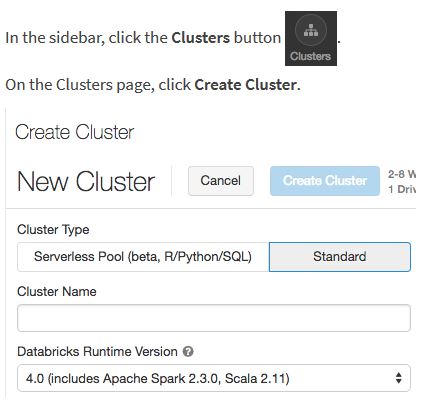
All AI pipelines within Azure Databricks begin with creating a Spark cluster. A cluster is the computing engine necessary for conducting big data analytics. While a cluster may be composed of several computers behind the scenes, an Azure Databricks user interacts with the cluster as if it were a single computer. The Azure Databricks workspace makes creating clusters easy; users need only to make a few choices regarding the initial size and type of computing resources.
Data: connecting to data sources and ingesting data
Once a cluster has been successfully initiated, it is time to ingest the data by first creating connections to the data source or sources. Azure Databricks allows for the integration of diverse data sources as if they were centralized; the platform provides a single view of a users’ data sources and fast, robust access to each data source via optimized connectors. Spark has an extensive set of data sources it can connect to out of the box. In Azure, these sources include, but are not limited to, SQL database, Azure Blob Storage, and Azure Data Lake Store. Azure Databricks also allows you to upload files to the service’s native file store, Databricks File System (DBFS).
The data used in this HR analytics project was stored in an Azure SQL Database. Azure Databricks readily connects to Azure SQL Databases using a JDBC driver. Once connectivity is confirmed, a simple JDBC command can be used to ingest an entire table of data into the Azure Databricks environment.
![]() This above bit of code results in what is known as a Spark DataFrame.
This above bit of code results in what is known as a Spark DataFrame.
![]()
Data: Spark DataFrames
Spark DataFrames are very similar to R and Python data frames and tables in relational databases. The DataFrame API has the distinct advantage of creating a columnar organization of distributed data that is optimized for the analysis of very large data sets. Use of the DataFrame API allows for data analysis using familiar languages such as Python, R, Scala, and SQL.
Exploratory Data Analysis (EDA) using Azure Databricks Notebooks
The Azure Databricks workspace is an integrated environment for a data scientist or a team of data scientists to explore data and build models in a self-service manner. Databricks notebooks are the foundational component of the interactive and collaborative workspace that simplifies exploratory data analysis and visualization of data. Several programming languages are supported in the notebooks including R, Python, SQL, and Scala. An end user must select a primary language for a new notebook but may choose to author code with other programming languages by using the appropriate language magic command – %[language], e.g. %sql. Such language flexibility allows data scientists to capitalize upon the unique strengths of individual programming languages for a given analytic pipeline without having to change notebooks or the workspace. Markdown and HTML also are supported in the notebooks to create non-code material for contextual information or report writing. A notebook must be connected to an active cluster in order to execute commands.
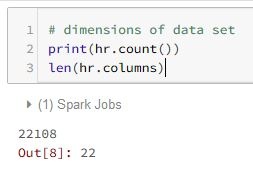
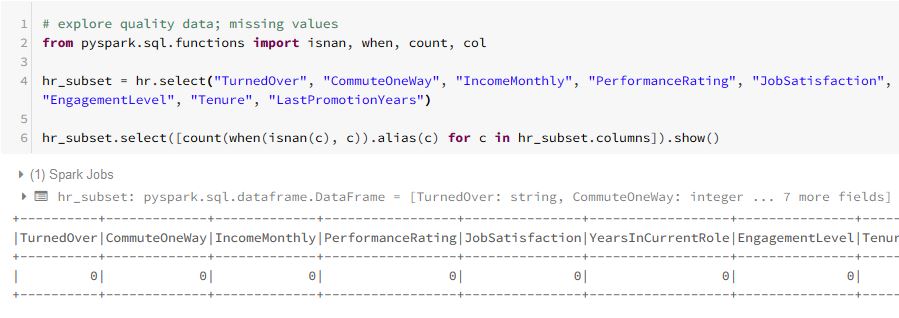
Here is a subset of some exploratory data analysis code written for the “hr” DataFrame:
 |
 |
 |
|
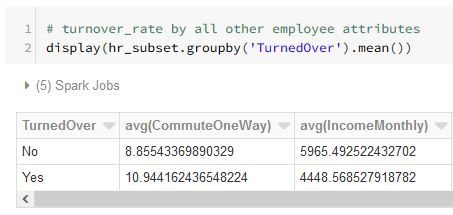
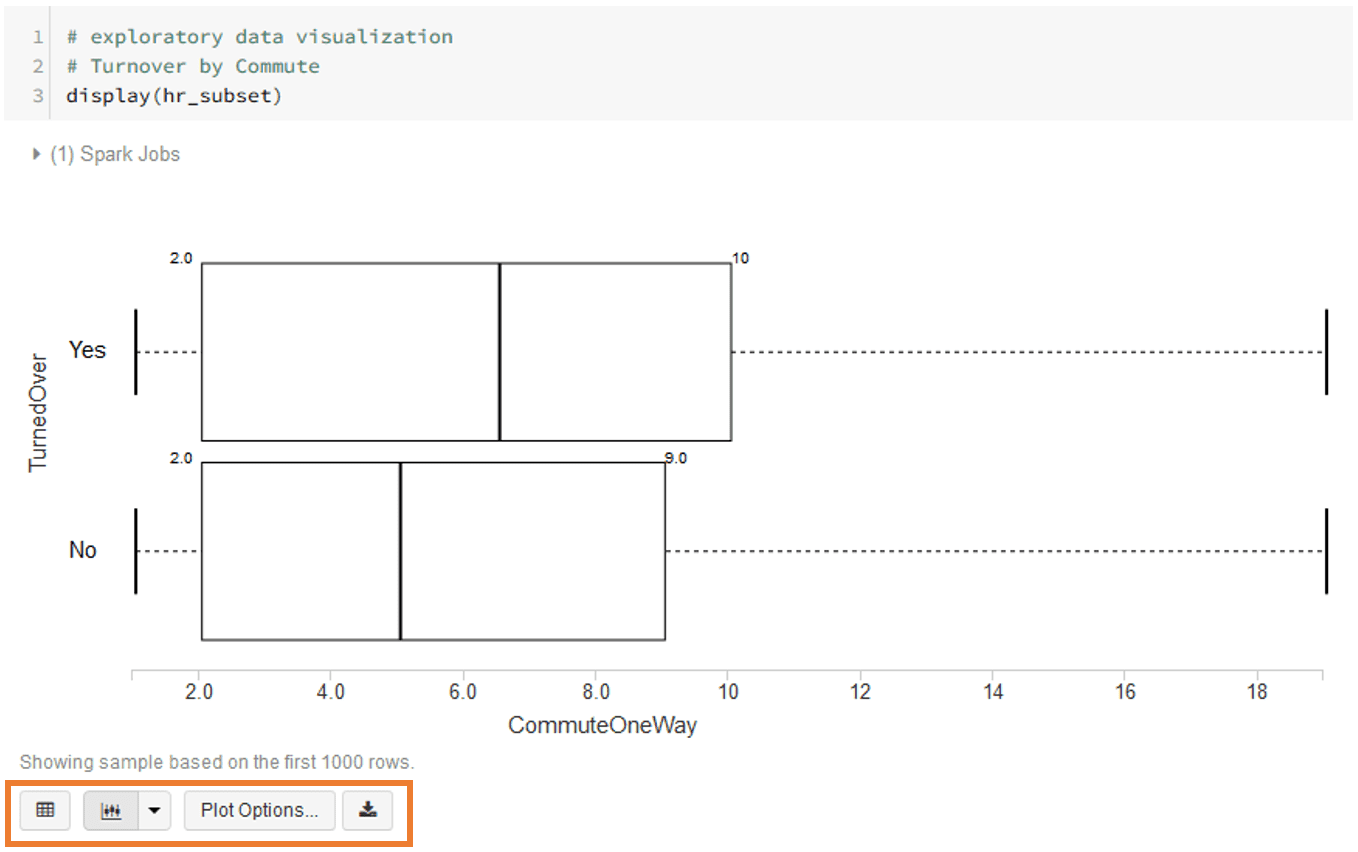
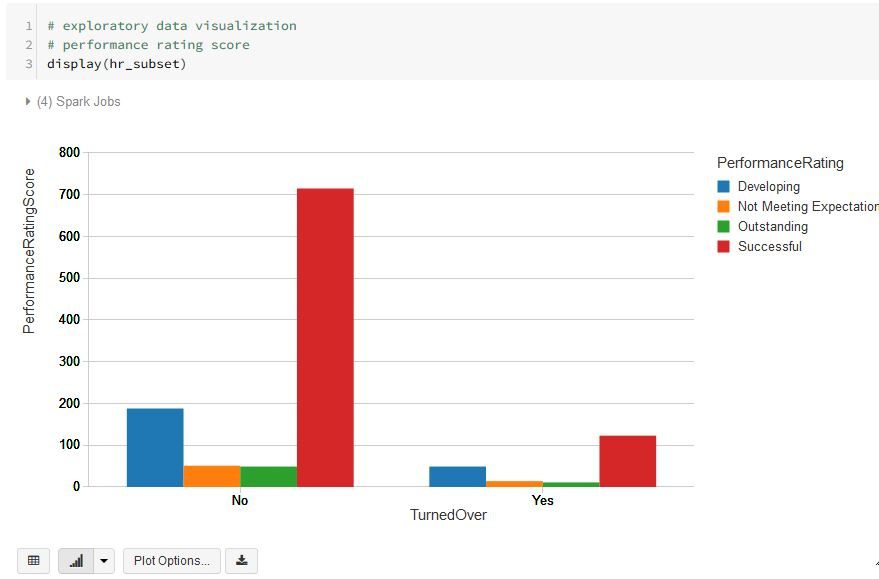
Exploratory data visualizations with the display() function
The display() function is an especially powerful manner by which to create informative exploratory visualizations of a data set.
Below are some exploratory visualization examples using the plot options function.
Model: build machine learning models with Spark ML
For data modeling, Azure Databricks includes the Spark ML machine learning library which provides all common machine learning algorithms, e.g. classification, regression, and clustering. These Spark ML algorithms allow for parallel, distributed training of models using large data sets located on Spark clusters. The DataFrame API is the primary API for the machine learning algorithms included in the Spark ML.
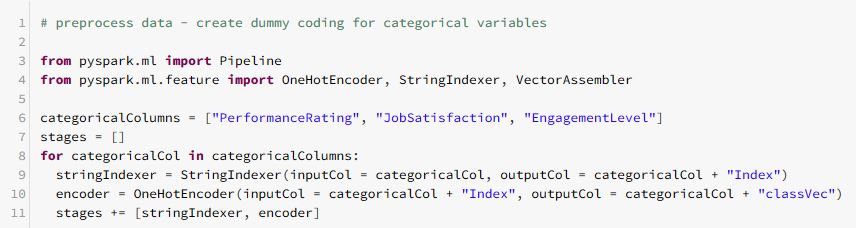
Using binary logistic regression, a classifier was trained using the “hr” training data with the objective to predict employee turnover. All the necessary preprocessing of the data (e.g. converting categorical variables into numeric variables) is easily conducted using the ML Pipelines API. Pipelines chain several modeling steps together, such as transformations, assembling of features, and fitting of algorithms. The Spark ML Pipelines will be familiar to users who have experience with Python’s scikit-learn library.
Conversion of categorical features:
Assemble features:
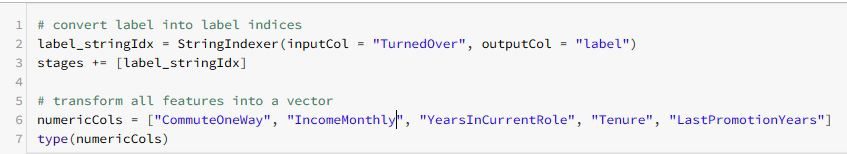
Create a pipeline:
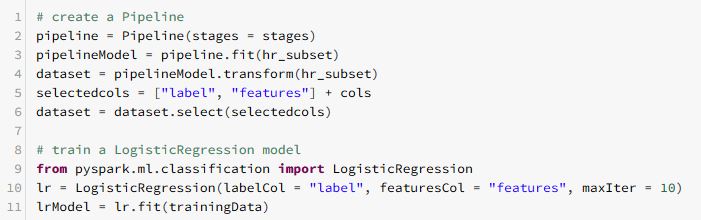
Once an ML pipeline has been built, Spark ML supports hyperparameterization using the ML functions parameter grid builder and cross validation. With further parameterization using 10-fold cross validation, the best model for predicting employee turnover was chosen. Predictions using the test data were evaluated using the common evaluation metric, area under the ROC curve. The trained model was then saved and used to evaluate new, never-modeled HR data. This new data and the resulting predictions were saved as a DataFrame on an Azure Databricks cluster.
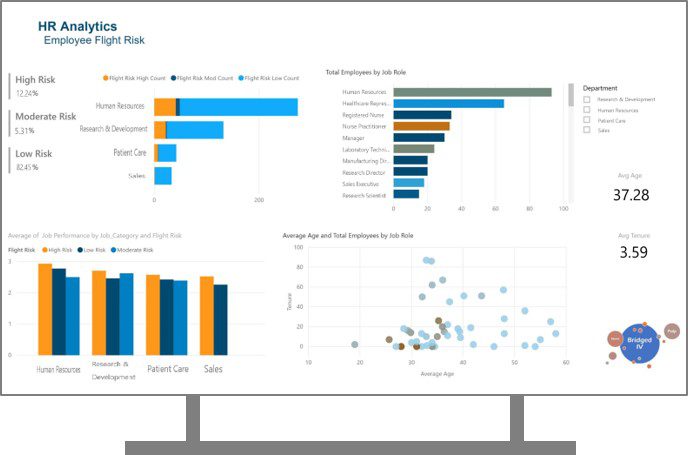
Share results using Microsoft Power BI
Numerous business intelligence tools can connect and ingest data from Azure Databricks clusters. Microsoft’s Power BI is one such supported business analytic tool. Using an JDBC/ODBC driver, an end user can connect Power BI Desktop to an Azure Databricks cluster.
The new HR data and associated predictions were brought into Power BI Desktop and a simple dashboard was created to share the HR employee flight risk results with relevant business stakeholders.
Note: for an interactive look at a Power BI dashboard for Healthcare Workforce Analytics,
check out BlueGranite’s Power BI Showcase.
Microsoft’s announcement of the general availability of Azure Databricks this past March received an enthusiastic welcome and inspired this HR analytics project. The experience of creating an HR data analytics pipeline within the Azure Databricks environment was made easy with the highly integrated self-service workspace. For those teams of data engineers, data scientists, and business analysts who are responsible for designing big data AI projects, Azure Databricks will definitively meet and exceed their analytic needs.
If you’re looking to put Azure Databricks to work for your organization, 3Cloud can help. Contact us today to talk with our team of experts and ensure success at every stage of your data development journey.
Azure Databrick’s documentation: https://docs.azuredatabricks.net/


