
Paginated Reports for Power BI offer pixel-perfect control over the format of each element of a report. They allow users to fine-tune each field of the report, such as text size, colors, spacing, and print layout, in a more precise way than using regular visuals in Power BI Desktop. Users can access Paginated Reports directly from workspaces in Power BI Service. Additionally, users can embed Paginated Reports directly onto a Power BI report page with the new visual option. This article will explain how to create a Paginated Report and how to configure the new Paginated Reports visual in Power BI Desktop. Please note that Paginated Reports require a Premium subscription. This tutorial is based on a fictional Sales Report.

Use Cases:
- Formatting pages around strict business requirements
- Recreating existing PDF reports that include varying types of fields, such as images, tables, etc.
- Needing to export large amounts of data from a table, as there is no row limit (usually 150k) for exporting data like in a traditional table or matrix visual
- Including totals in reports (exports from Power BI visuals do not include totals, but Paginated Reports can)
- Optimizing page layouts to be easily readable and fit appropriately on a page (exporting data from matrices can lead to confusing page layouts)
- Setting up automatic email subscriptions that contain the entire report output
Creating a Paginated Report:
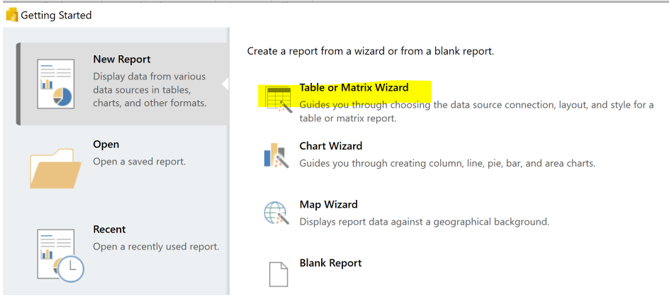
To create a Paginated Report, open and sign in to Power BI Report Builder, then select Table Wizard.
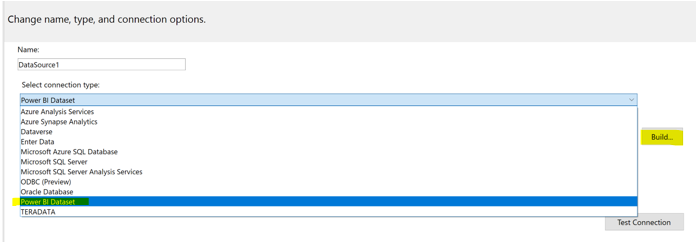
Next, create a dataset based on a connection to a Shared Dataset by clicking the “New…” button at the bottom of the window and selecting “Power BI Dataset” from the connection type drop down menu.
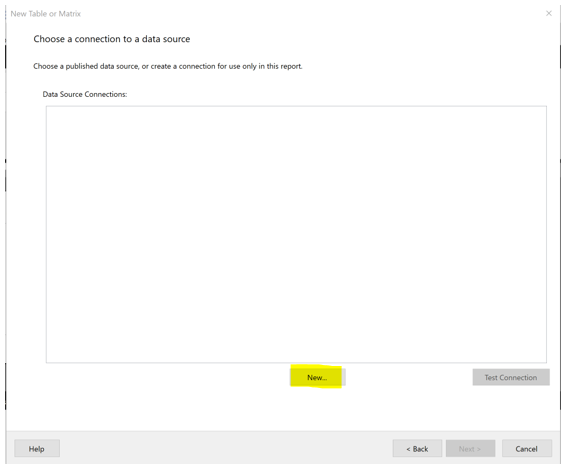
Please note that you are able to connect to a wide variety of different data sources to create your report, additionally you can enter data manually.
Click the “Build…” button on the right side of the window and select the appropriate dataset. Report Builder automatically generates a connection string that connects to the dataset from the workspace. Click the “OK” button at the bottom of the window.
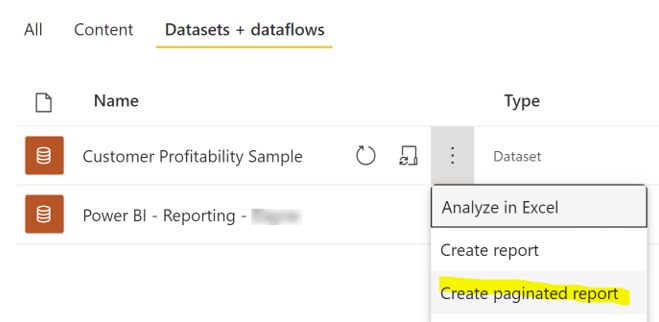
Another way to connect to a dataset is by connecting through Power BI Service. Navigate to the dataset in the “Datasets + Dataflows” section. Click the ellipsis icon next to the dataset’s name and click “Create Paginated Report”.
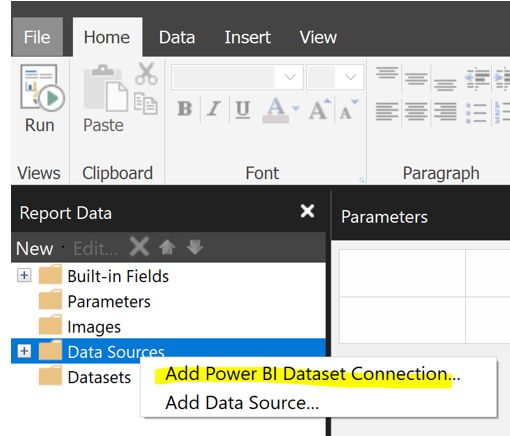
Power BI Service then creates a blank Report Definition Language (RDL) file based on the dataset. To build a report, open the RDL file, and right click on the Data Sources option on the left side. Click Add Power BI Dataset Connection and select the data source from the workspace.
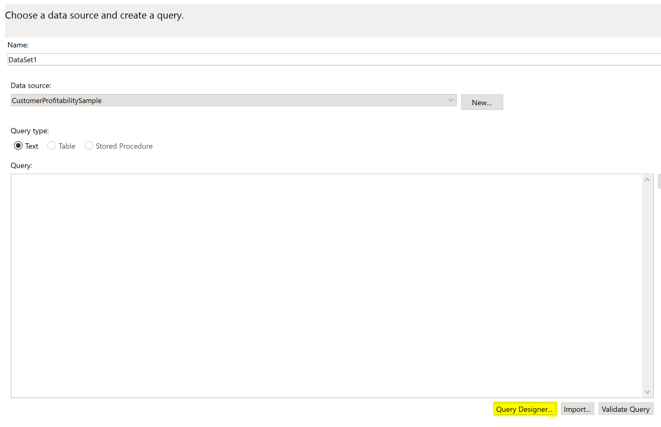
Next, right click the “Datasets” section and select this Data Source. Select the “Query Designer” button at the bottom of the screen.
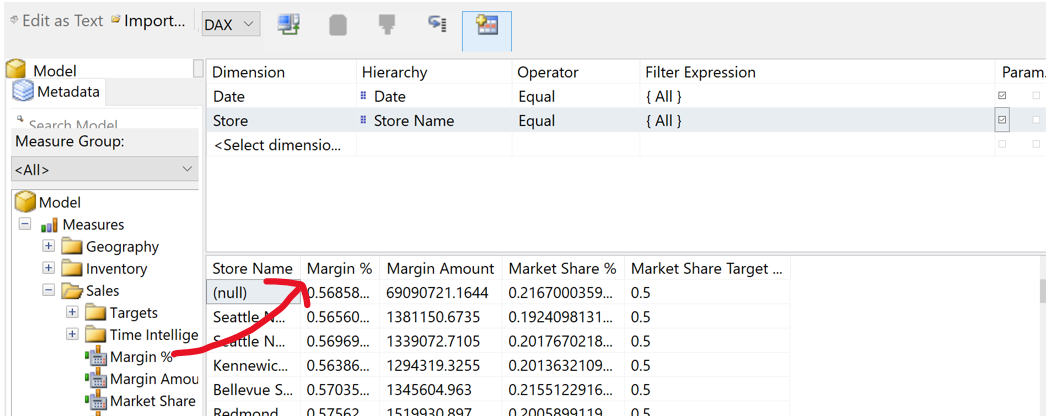
The next window is the Query Designer. From here, you can access all the fields from the dataset. The top section is for report parameters. Here, you can select any dimension from your model that you want to be a parameter, which is a value that you want users to be able to filter their report by, such as date or company name. (Tip: setting parameters is like having a “where” clause in SQL). Click inside the box underneath the header “Dimension” to select the parameter value and configure the Hierarchy, Operator, and Filter values. Check the box on the far right to set this field as a parameter.
![]()
The middle section allows you to drag levels and measures from your dataset into the report. Select your measures from the Measure Group section on the right and drag them directly onto the canvas section in the middle of the Query Designer, then click OK to apply the changes. You can preview the report by clicking “Click to Execute the Query”. Click Next at the bottom of the wizard to continue.
Note: another method of inserting your data is by first creating a table in Power BI Desktop with the format and aggregations needed. Then, go to the Performance Analyzer from the View tab and start recording to retrieve the DAX code of the visual. Paste the DAX code into the Query Designer by clicking the Design tab. This method bypasses the Query Designer wizard as outlined in the rest of this section.
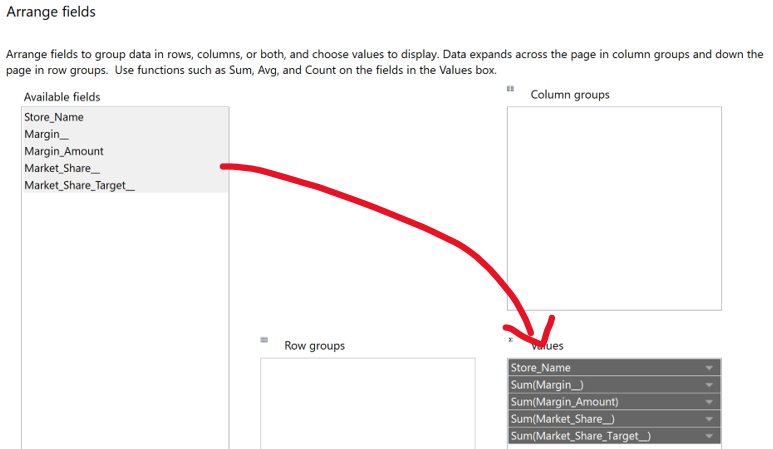
Select all the available fields and drag them into the Values bucket. Click Next at the bottom of the window.
On the next screen, there are options to add subtotals and totals if you configured Row or Column Groups in the previous step. Click Next to continue.
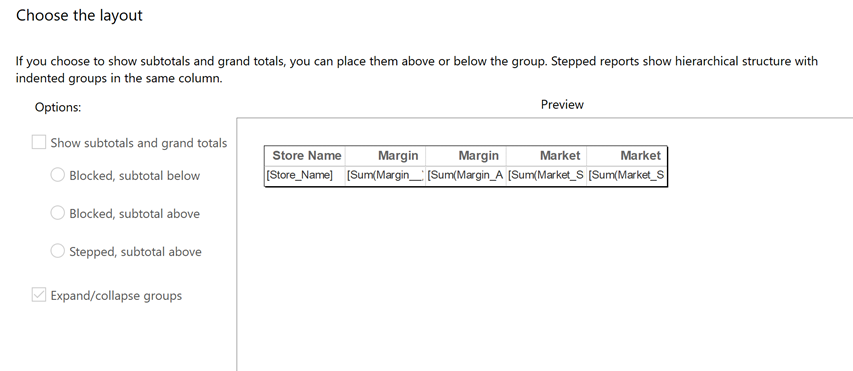
Click Finish to exit the wizard. Now, you can work with your table in Design View. (Tip: The Design View functions in the same way as Microsoft SSRS Report Builder).
Design View Layout
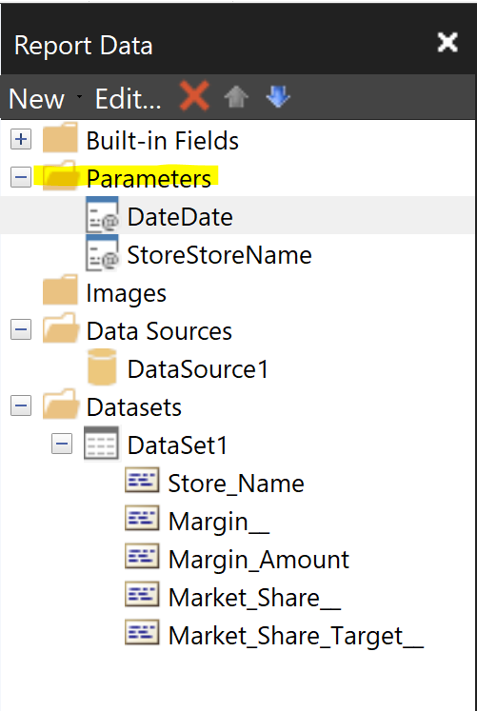
In Design View, you can control each element of your report’s format. On the left-hand side, expand the Parameters section to control the functionality of the Report Parameters. Double click the Parameter’s name to explore the Properties window.
Here, you can modify the data type, set the Available Values for users to select from, and set Default Values.
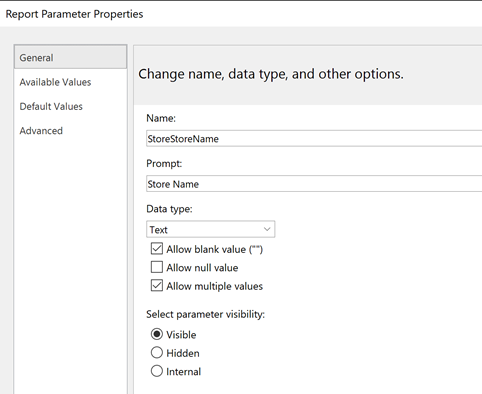
Note: if you are going to embed the Paginated Report into your PBIX report using the new visualization, the data type of your Parameter must match the data type of the fields in your PBIX report.
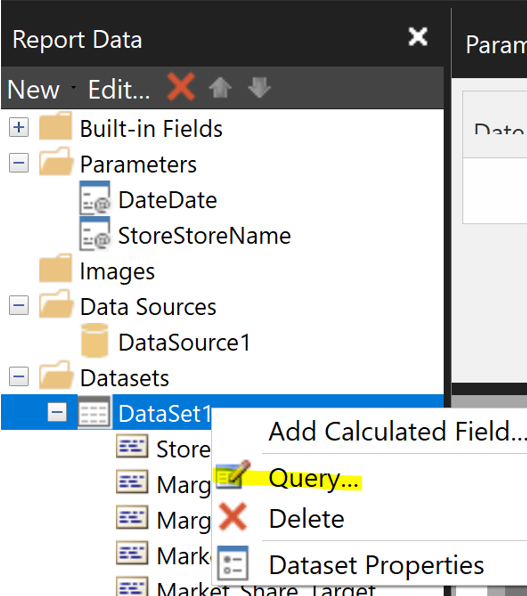
Right click “Data Source” to edit the Data Source settings or add additional data sources and datasets.
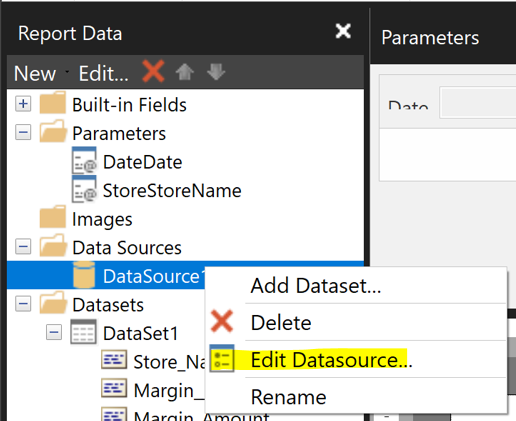
Similarly, right click the Dataset name to view and edit the dataset’s query.
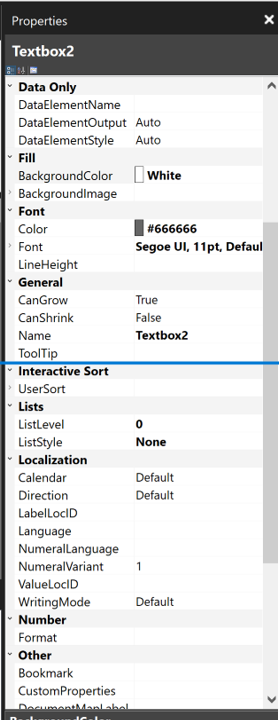
When you select a text box or a table, you can modify its elements in the Properties pane located on the far right-hand side. You can also set dynamic properties of text boxes to enhance functionality.
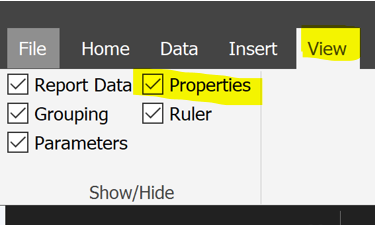
Note: If the Properties pane is not showing, click the View tab in the top ribbon, and check the box next to Properties.
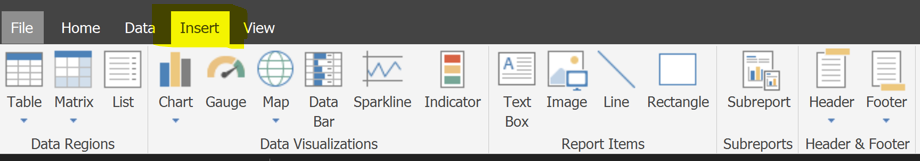
In the top Ribbon, select the Insert tab to Insert charts and other visuals into your report.
Formatting the Report
Click inside the header to edit the header of the report. You can insert Parameter information here by typing [@ParameterName] or by expanding the Parameters section on the left and dragging the field onto the canvas.
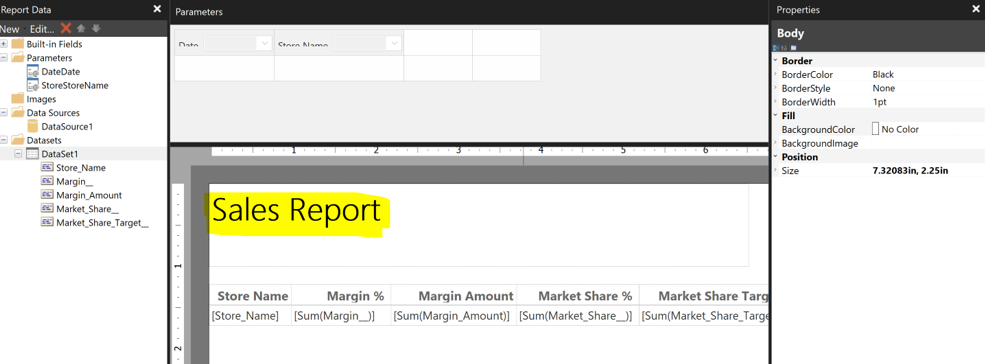
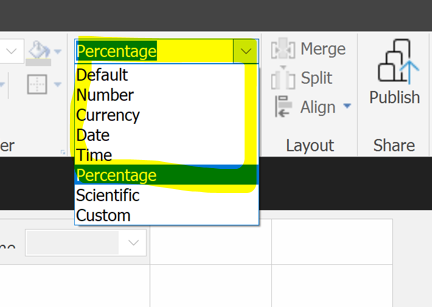
Click the cells inside of the data table to modify the data type of each of your fields; this changes how the fields will be displayed in your table. For numeric fields, you can specify the number of decimal places and insert comma separators. You can modify the header names for the table by selecting the header text box and typing over the existing text.
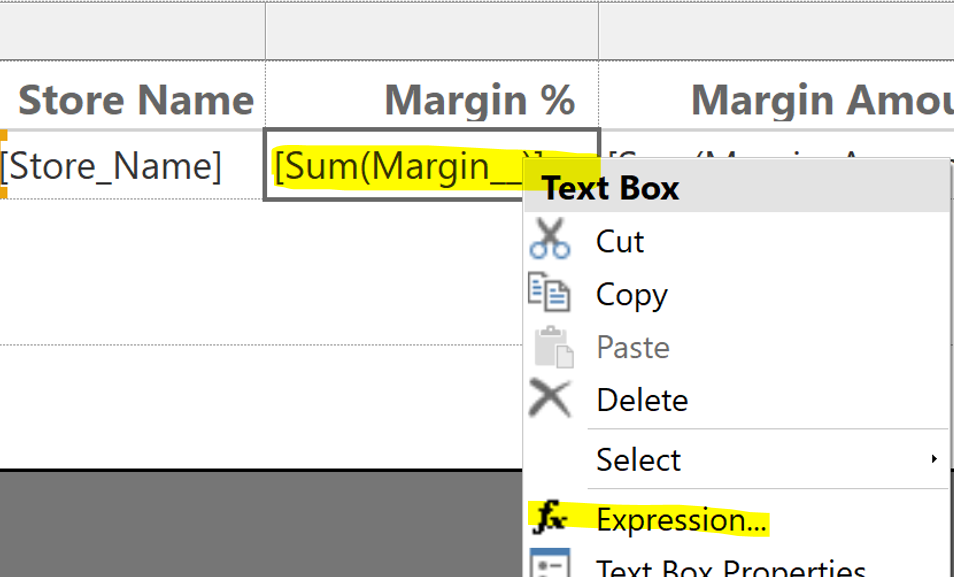
Further, right click any text box and select Expression to create expressions.
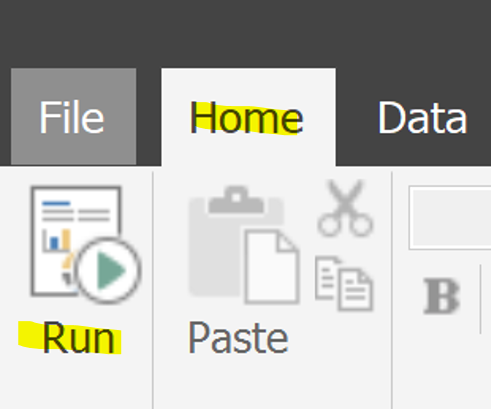
Previewing the Report
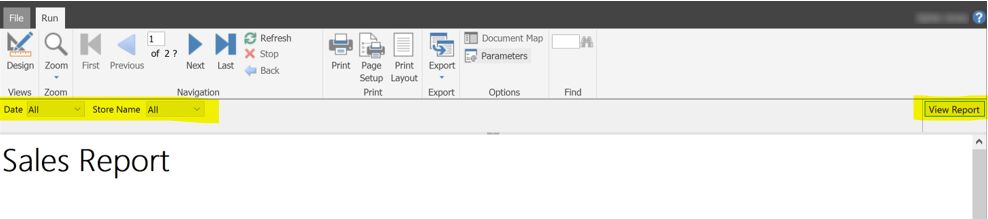
To preview your report, go to the Home tab and click Run.
Here, test the functionality of the report. Make Parameter selections and click View Report to see the resulting data. You can also modify the print layout format.
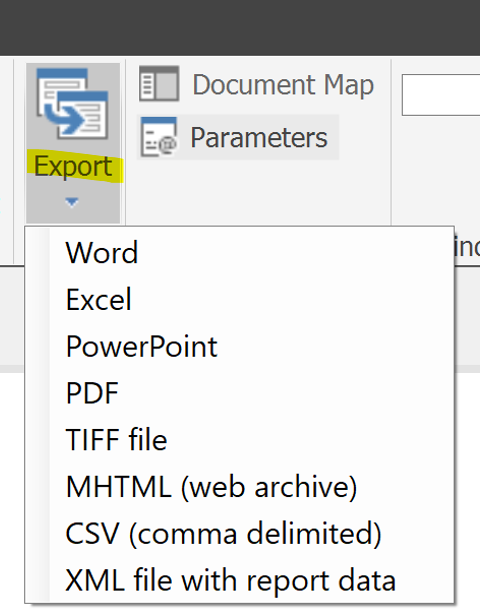
You can Export samples of your report to several different formats, such as Excel and PDF.
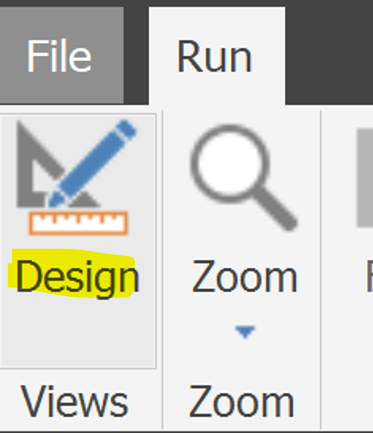
To navigate back to Design View, Click the Design button on the far left of the Ribbon.
Publishing the Report
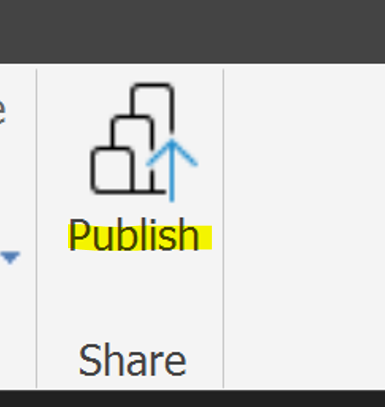
Click Publish from the Home tab to publish the report to your workspace. Once you publish your report, it is visible alongside the other assets in your workspace. Users can access the Paginated Report from Power BI Service.
Using the Paginated Reports Visual on Desktop
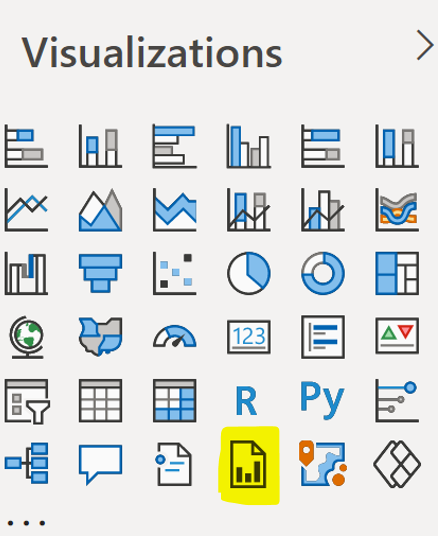
After creating a Paginated Report, you can embed it directly into any Power BI Report PBIX. Open the Report PBIX in Power BI Desktop and sign in to your account. Select the Paginated Reports visual from the Visualizations pane and click Connect to Report.
Please note that this feature is still in Preview mode as of the time of this blog post. To ensure that the feature is enabled, go to Settings, click Preview Features, and ensure that the Paginated Reports check box is checked.
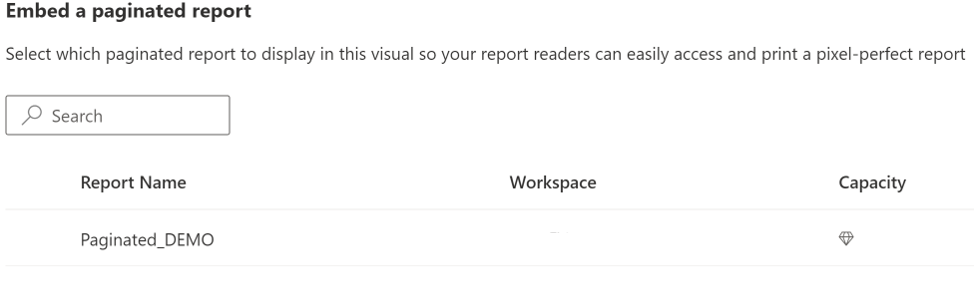
Select the Paginated Report from your workspace. Click “Set Parameters” to continue.

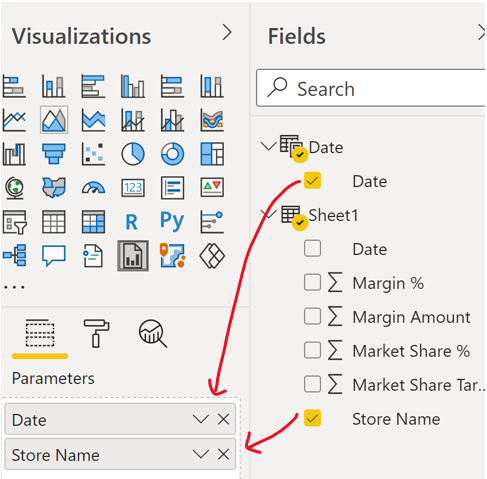
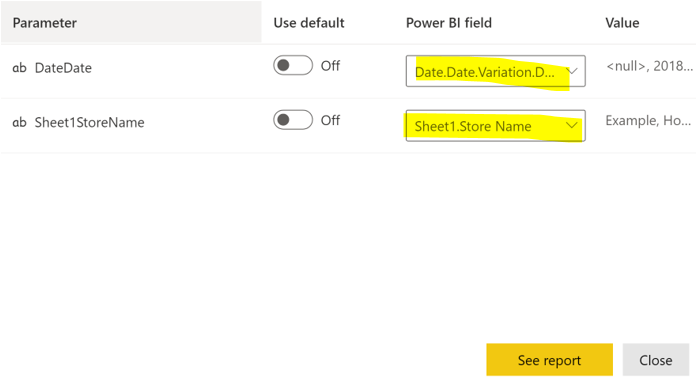
Next, select the fields you will use for the parameters and drag them into the Parameters well of the Visualizations pane. On the report canvas, map the fields to each corresponding parameter value or toggle on Use Default if you have set a default value for your parameter.
Click See Report at the bottom of the window to apply the changes.
To interact with the visual, go to the Filter Pane and make selections for parameter values, or add slicers onto the report canvas for your parameter values. Click Apply Changes on the Paginated Reports visual to see your slicer selections in the visual.
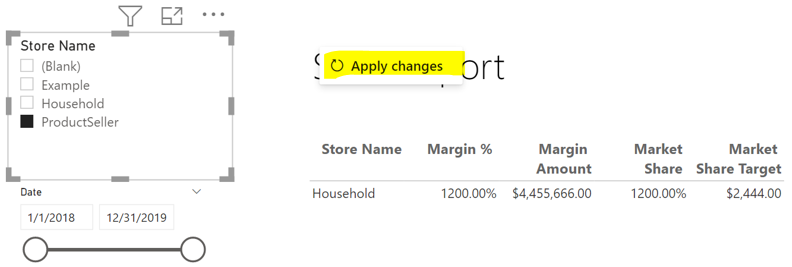
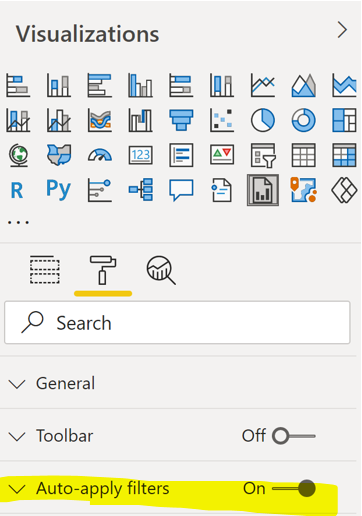
Tip: To make your slicers automatically update the Paginated Reports visual, select the Paginated Reports visual. Go to the Format tab of the Visualizations pane and toggle on “Auto Apply Filters”.
Conclusion
Paginated Reports allow users to create precise reports that are custom formatted to display well on a page. If the user needs to adhere to strict formatting requirements or to export more than 150,000 rows of data, Paginated Reports are the perfect solution. By utilizing the Power BI visualization, report users can access the Paginated Report directly within the Power BI report without needing to enter the workspace.
Contact Us
BlueGranite has strong experience deploying a mix of both Power BI and paginated reporting in organizations of all sizes. If you’re wondering how paginated reports could better fit into your Power BI deployment, contact us today!
BlueGranite offers a variety of resources to help you learn how you can leverage Modern Data Analytics. We also offer free training events such as:


