Headlines such as Reuters’ “U.S. job openings at record high; qualified workers scarce” underscore the need for organizations to predict and manage employee flight risk. Many of today’s data-driven companies use predictive analytics as a mission-critical tool to mitigate the high cost of managing employee turnover by first identifying which employees are at risk of leaving the organization. If you are looking to leverage the power of advanced analytics to lower the rate of your organization’s employee turnover, it all starts with the quality of your data.

The relative worth of any good predictive analytics project begins with the data it is fed. A common phrase in the realm of data analysis is “garbage in, garbage out”, however it equally could be “quality in, quality out”. The nature, amount, and validity of the data that a predictive model ingests strongly influences the worth of the model.
Traditionally, predictive employee flight risk models are based entirely on the employee data that is tracked and stored in an organization’s human resource system. This historical data contains a wealth of information relevant to predicting employee turnover.
Some of the most commonly used employee information (or from a modeling perspective, predictor variables) includes:
- Tenure or duration of employment
- Compensation level or ratio
- Date of, or time since, last promotion
- Percent of most recent pay raise
- Job performance rating/score
- Distance to/from work
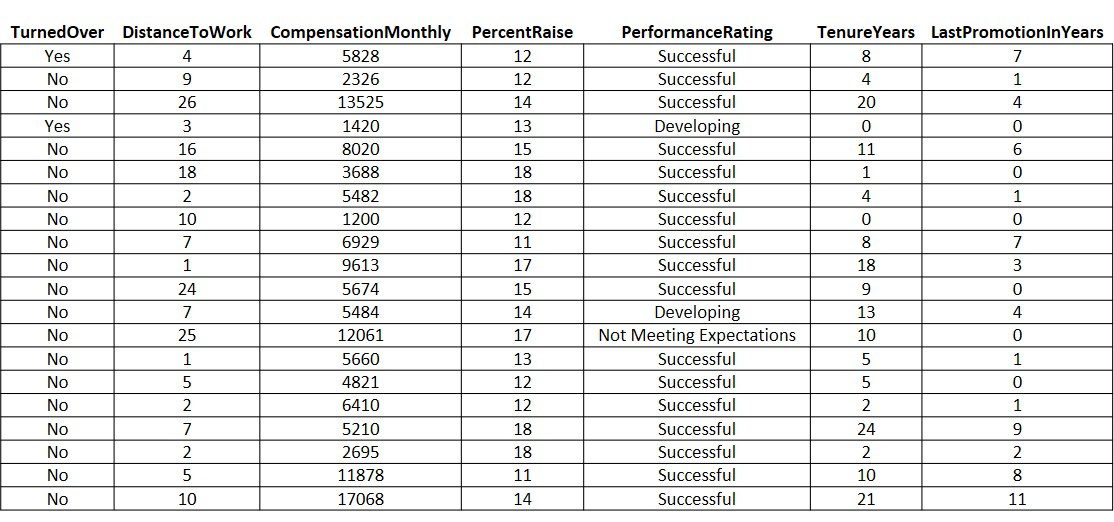
Developing your first predictive model of employee turnover can be a confusing and intimidating project.
How much data is enough? Do I have the correct type of data?
The “start small and think big” approach can address these modeling concerns. Start with the relevant data you have currently and plan for the growth of the model as additional employee information is tracked. The above list of predictor variables is a very good place to start. If your objective is to be able to predict employee turnover, you’ll need to include that employee attribute in your data set as well. That is, you need to know the employment status of each of your employees (i.e. turned-over, yes or no) since this is the outcome, or target variable, you are attempting to predict.
Let’s start with these six predictor variables and run a classification analysis. A gradient boosted classification analysis was run on a demo data set consisting of 1,200 observations. Predictive employee turnover models are known as classification analyses because the results classify an employee as either yes or no for flight risk. The subset of data that was set aside for evaluating the model had 37 employees who were no longer employed, i.e. turned over = yes.
With this initial set of predictor variables, the overall accuracy was 42% and specific results were:
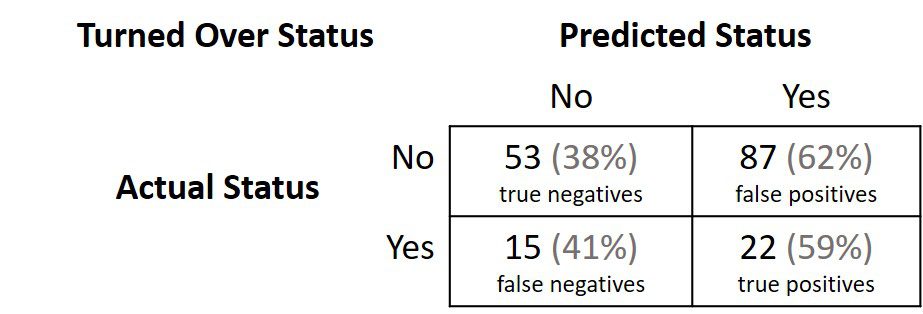
What to make of these results? To start, the level of accuracy is poor. How should we interpret true/false positive/negative values?
Intuitively, a model’s accuracy is an appealing metric by which to evaluate the worth of a model. However, accuracy is not a good evaluation metric when the analyzed data has a target variable that is not equally split (e.g. equal number of yes and no turned-over employees) and nearly all employee turnover data sets will be unequally split.
In the case of predicting employee turnover, it would be better to decide which error (false positive or false negative) would be least costly when it comes to expending resources to retain current employees.
False positive: making the error of predicting an employee is likely to turnover when in fact s/he is not looking to leave the company (this may waste retention resources but ultimately the employee does not leave and costs of replacing and retraining are not spent).
False negative: making the error of predicting an employee is not a flight risk when in fact s/he is looking to leave is a costly mistake. The employee is not included in any retention efforts and the company loses a valued employee.
Let’s increase the quality of the data set by adding new predictor variables to the model to see if the false negative error rate can be lowered and accuracy increased.
Additional quality data for predicting employee turnover can include predictor variables such as:
- Job satisfaction rating/score
- Satisfaction (rating/score) with the work environment
- Number of previous jobs/positions held
- Years with current supervisor/manager
- Engagement score/rating
The same data set was used with 1,200 observations and a gradient boosted classification analysis was run. With this second set of predictor variables, the overall accuracy has increased to 72% and specific results were:
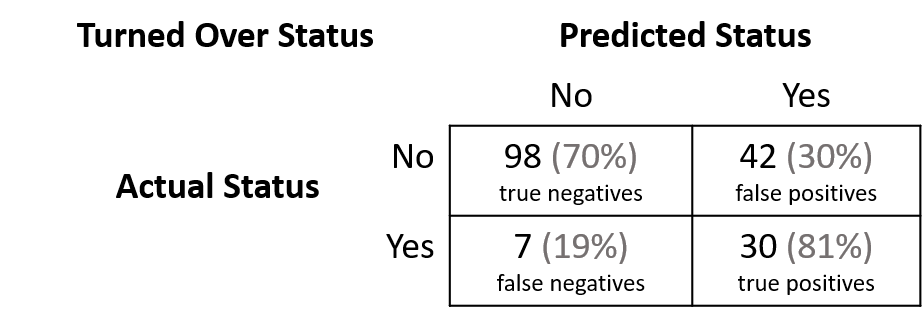
With this expanded set of data points, both metrics were improved upon. The model has a higher overall accuracy and a lower rate of incorrectly predicting an employee has stayed with the company when, in fact, the employee has left.
These employee attributes can easily be found in most organizations’ human resource databases. However, additional quality data can be added to the model from external or third-party sources. Such external or third-party data could include:
- The availability of qualified employees
- Compensation rate/salary for similar positions with other employers
- Tenure at previous job(s)
- Health of the labor market
Moreover, changes to how the model is run could be done to improve the ingestion of quality data. For example, if practical, it is recommended that predicted employee turnover models are run individually for different departments, job roles, and/or locations. If there is any reason to believe the factors that may influence an employee’s decision to look for employment elsewhere may differ based on status and/or location, it may well improve the model to run these groups of employees separately. This decision often is weighed against the need for a large data set.
Classification analyses are best run with large data sets, i.e. high hundreds, thousands of observations. As the number of predictor variables in a model significantly increase, so too should the number of observations. As such, data sets for predictive employee turnover models often include multiple years of human resource employee information.
Once the analysis and metric evaluation tasks are complete, it is time to deploy the model and explore the success of your organization’s retention programs and campaigns. With a model that is strategically implemented with the best quality data available, your predictive employee turnover model should be able to successfully scaffold your organization’s employee retention efforts.
Want to learn more?
If predicting employee turnover seems baffling, BlueGranite can help. To learn more about how our experts can work with your organization, check out our Employee Retention QuickStart offering, or reach out to us! We’re always happy to help.

