
The vast possibilities of data-driven government – including the potential to more efficiently deliver services, minimize costs, increase transparency, and drive innovation – is propelling increasing interest in harnessing data and analytics for the greater good. Done right, smart cities leverage tech to benefit people, simplify processes, and improve quality of life. These attributes make them desirable places to live, which, in itself, can bring countless additional benefits.
Rankings of the world’s most successful smart cities show they share common characteristics, chief among them is prioritizing citizens’ needs. But becoming effective doesn’t happen overnight; it requires a thoughtful, well-considered approach to technology. Taking the first step, by starting to tell the stories behind important city numbers, can lead to data-driven municipal achievement.
Discover Opportunity in Numbers
Digital transformation can often begin just by examining the numbers being discussed by municipal leadership. Is the mayor reporting how many potholes have been or need to be filled? Maybe the city manager is concerned over a poverty rate increase – or the police chief is raising visibility of high-accident areas. It’s likely someone is already regularly pulling and possibly tracking such numbers on a spreadsheet. Depending on where you are in your data strategy, someone may also be storing and updating those numbers in a database. This can be an opportunity to showcase smart-city possibilities.
Even if the data for your use case scenario is inaccessible, try searching for a similar dataset in an open data portal. For instance, yearly poverty estimates for your municipality are reported in the American Community Survey at data.census.gov. The FBI collects data from police agencies across the country and makes it available at data.gov. Your state may have an open data portal, and in it, there may be data about infrastructure quality (like traffic volumes or bridge conditions) – see a site like data.ny.gov for those statistics.
Build a Simple Visualization
Once you have found a relevant spreadsheet or database, create a straightforward data visualization displaying how the number in question has changed from week to week. The tool you use to build these initial visualizations doesn’t matter – the goal is to show the added value of examining public numbers in greater depth and over a longer period of time. Start with a tool you know, or that is available within your organization.
For example, it’s great if you build your first visualization in Excel. It will be easy to share and many of your colleagues will likely know how to navigate what you’ve built. Better yet, if you have access to Power BI (you can sign up for free here) you can design rich, interactive visualizations or take your first steps toward building a more in-depth dashboard.
Further, if you can build visualizations in Python or R, you can save your colleagues responsible for reporting the numbers a lot of time – because your code will ultimately automate their task and it can be used in Power BI.
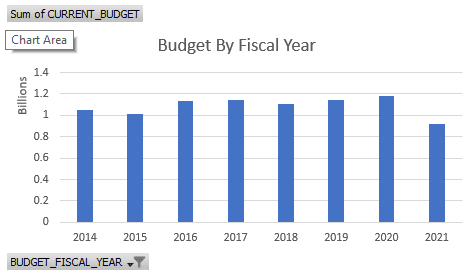
For demonstration purposes, I pulled budget statistics from the city of Cincinnati’s open data portal, then created virtually the same very simple visualization in Excel, Power BI, and R. We’ll start with Excel:
Then, in Power BI:
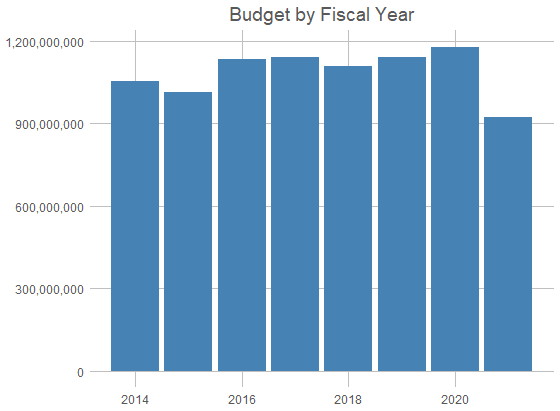
and also in R:
Tell the Story Behind the Numbers
Now that you have a visualization to share, investigate the story behind the numbers. Does it highlight a success? Is there a problem to solve? How can you use this data to benefit your population? In the simple visualizations above, Cincinnati’s budget rose from just above $1 billion in fiscal year (FY) 2014 to almost $1.2 billion in FY 2020, before a sharp decline in the 2021 fiscal year budget. This simple data analysis is easily accessible, tells a story about the municipality, and leads to more questions: Why did the budget suddenly drop? Was that drop equal across departments? How have individual department budgets changed over time? Have departments underspent or overspent their budgets?
Using data to spur these kinds of questions, and further, to help decision-makers dig into potential causes and solutions, can successfully kickstart a data-driven municipal evolution. When municipal leaders begin sharing these numbers with the biggest stakeholders – the residents – it can lead to buy-in for necessary projects and further data-led initiatives that prioritize people.
Well-Considered Next Steps
As decision-makers begin to delve into the details behind the numbers, and municipalities begin navigating digital conversion potential, questions around data access, regulation compliance, documentation, and the rights tools are bound to arise. A thorough approach, guided by a digital transformation expert, can help ensure next-step success, whether by helping you explore best practices, identifying and outlining technology governance and security requirements, or showcasing how to maximize and integrate your existing resources to help you realize rapid time to value.
Follow these links to learn more about how Blue Granite has helped other municipalities – including evolving education strategies, fostering traffic safety, and ensuring water quality. Or take a moment to check out our Modern Data Platform and Modern BI pages to discover how the right advanced technology can transform outcomes.


