
Hosted in the beautiful San Francisco from January 27th to the 30th, the rstudio::conf(2020) kicked off with two days of training followed by two days of jam-packed session on everything R. Every year, this conference grows and welcomes more and more statisticians, data scientists, researchers, viz experts and more. This year, the conference attendance jumped to an impressive 2,242 people! In this post, I want to recap some common themes that I heard at the event along with some cool packages I learned about along the way.
RStudio is now a B Corporation
At the keynote on day 1, RStudio CEO, J. J. Allaire made the announcement that RStudio, Inc. is now RStudio, PBC, a Public Benefit Corporation. This new structure allows for the company to focus on open source development of software and put their mission and other stakeholders on equal footing with shareholders. It will be interesting to see how this change allows RStudio to balance the creation of professional products (like RStudio Server and RStudio Connect, which they sell to companies) with the continuation of making amazing open source products that benefit us all. To me, the most interesting part is the open annual reporting of RStudio’s contributions to benefit everyone, which can be seen at bcorporation.net/directory/rstudio.
Read more about their change to a B Corp here.
Cool Packages
Many of the sessions included speakers talking about their development of innovative packages for a variety of purposes. Here are just a few that stuck out to me as either really useful or just plain fun…
| vctrs | Provides size and type-stability to vectors and avoid undesirable behavior when mixing different S3 types. |  |
| vlbuilder | Create interactive Vega-lite graphics in R. |  |
| tidymodels |
A suite of packages that includes a core set of packages for modeling and statistical analysis using the grammar and data structures of the tidyverse. Includes recipes, parsnip, and tune, which are awesome packages for data preparation, ML modeling, and tuning, respectively. |
 |
| brickr | Create 2D and 3D LEGO® art and generate real step-by-step instructions for building your brick art in the real world. |  |
Asynchronous Programming
In addition to the packages listed above, I attended quite a few talks around scalability in R. Out of the box, R is a serial, scripting language. Due to the hard work of some developers, we can now use packages that allow R to complete tasks asynchronously. In other words, we can do scale our code by doing multiple tasks at once. Previously, this was done using the foreach package along with a package like doParallel to parallelize iterations of a task.
Henrik Bengtsson’s package, called future, provides a very simple and uniform way of evaluating R expressions asynchronously on whatever resources the user has available. This is accomplished by using the new %<-% operator and giving the package a “plan” of how to execute.
library(future)
|
One complaint programmers have about distributing your code is that it’s difficult to tell how much work has been completed while you’re waiting. Bengtsson’s solution to this is the progressr package, which will allow for overall progress of a task to be returned to the user, even when distributing the task across CPU cores or machines in a cluster.
library(progressr)
|
Lot’s of Shiny
For those of you who don’t know, Shiny is a web development framework for R. It allows for R programmers to create responsive web applications easily using R and all your favorite packages.
Traditionally, Shiny works by rendering a Bootstrap page complete with UI elements, graphics, and the works. If you’ve ever created a Shiny app before, you’ve probably used the shinythemes package to quickly give your app some color and style.
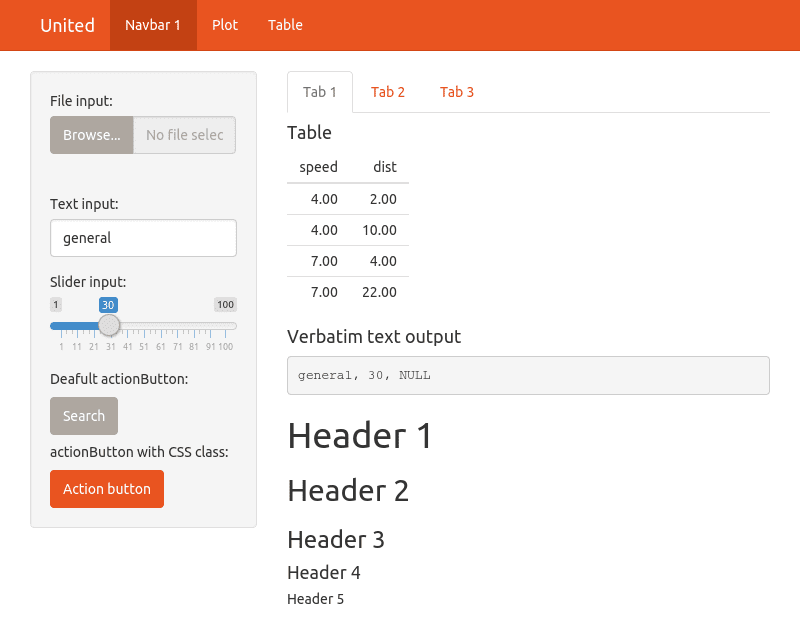 However, if you wanted to completely change all the styles of a Shiny app (for example, to match your company’s brand standards), you have to write custom CSS. Now, thanks to the bootstraplib package, you can easily make global variables in your R code to finely tune your style. And there’s even a theme customizer to interactively try out a new look.
Lastly, developers often create Shiny apps to provide an easy-to-use interface into a particular type of analysis, data, or visualization.
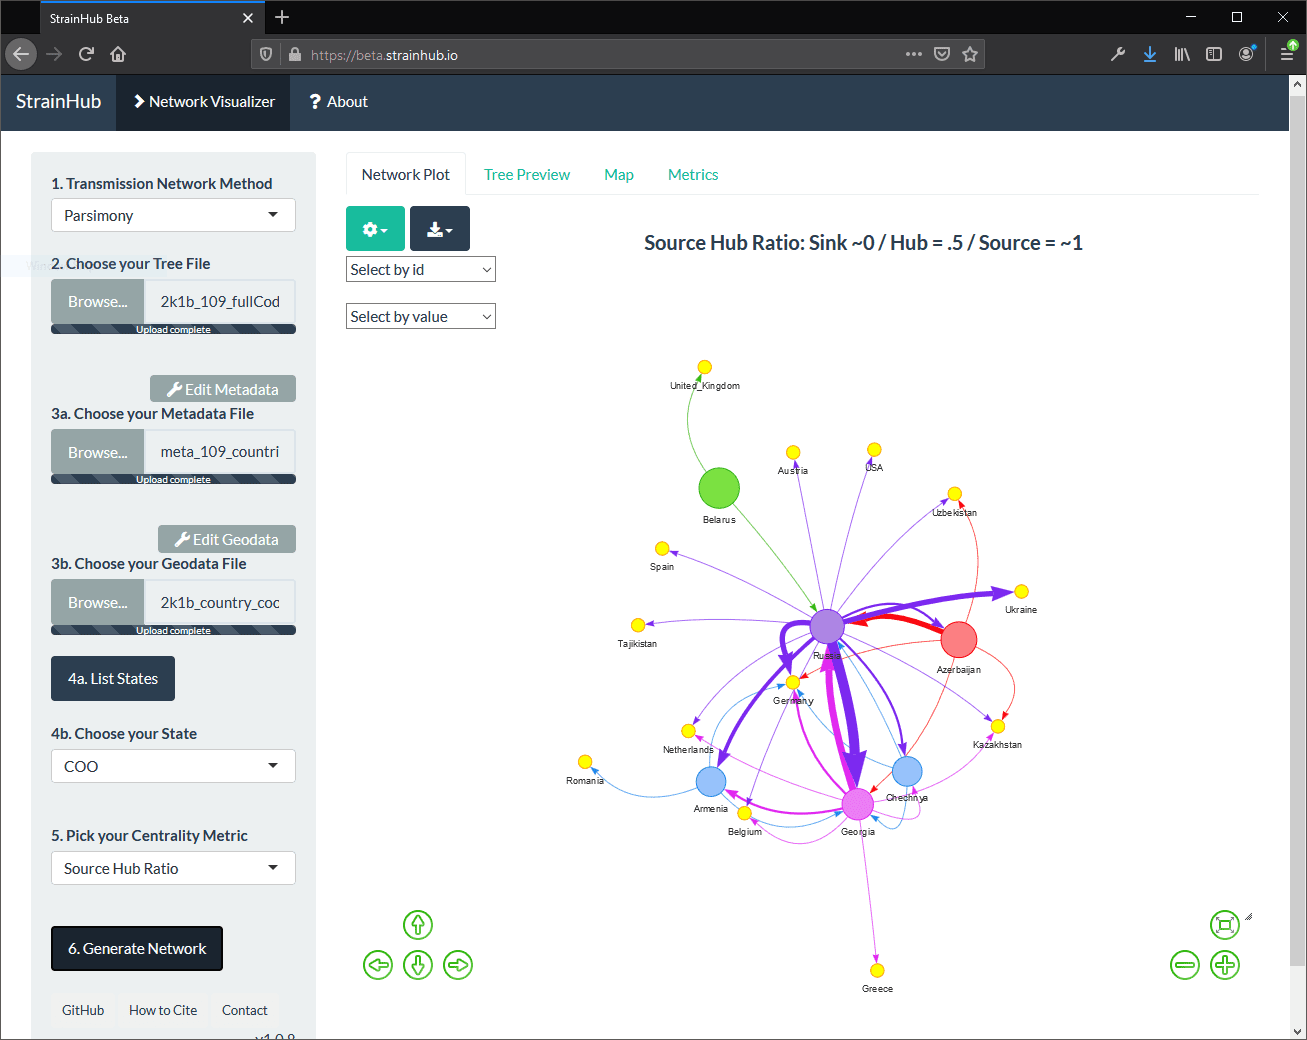
Let’s take my application for example: StrainHub. In a nutshell, StrainHub is a phylogenetic tools built in Shiny that allows researchers to build transmission networks from metadata. In the screenshot below, a transmission network is generated using a dataset of Hepatitis C isolates. (Specifically, a phylogenetic tree + accompanying country metadata.)
 While this application is a great interactive tool for epidemiologists or public health researchers that don’t want to use R to generate the visuals, Shiny apps can be a bit ephemeral in the sense that reproducing this output (for research transparency and publication purposes) requires that the user have the exact data and analyze it using the same version of StrainHub in the future to guarantee the same result. This poses a problem if there are code changes down the line.
Welcome, shinymeta! The shinymeta package provides tools for auto-generating R code that captures the logic from your Shiny app. In other words, a user can now interact with your app and then generate a code and output bundle of the results. This is PERFECT for researchers who want to use someone’s app and want to publish on the results of the app as this allows them to create reproducible artifacts from the analysis in Shiny. As a researcher myself, this was one of the coolest things I saw at the conference!
R + Microsoft = ❤
In previous years, you may have noticed Microsoft’s focus on the use of Python in Azure Machine Learning Service (AMLS). However, as of November 2019, Microsoft has released an R SDK for AMLS. For more information about the R AMLS SDK, see: https://azure.github.io/azureml-sdk-for-r/.
Also, if you’re an Azure Databricks aficionado, you already know you can take advantage of the R API for Spark (SparkR) or you can use RStudio’s sparklyr package for a more dplyr-like experience. For more information about R in Azure Databricks, click here.
Resources
You can find the recordings of all the conference sessions here: https://resources.rstudio.com/rstudio-conf-2020
…and Emil Hvitfeldt has curated a list of the slide links, etc. here: https://github.com/EmilHvitfeldt/RStudioConf2020Slides


