It’s hard to talk about machine learning without someone bringing up Microsoft R or R-Studio. Although it has been around for over two decades, R has recently gained immense popularity by entering the big data landscape. With Microsoft’s release of SQL Server 2016, we now have an enterprise data warehouse directly integrated with one of the most diverse and open source analytical engines available. However, R is far more than just an analytical engine.

Capabilities

The demographic for R is truly based on Data Scientists or quantitative people, but it’s not limited to just algorithms thanks to its ability to use custom packages developed by a large community of users. Packages can be as simple as a single function or as involved as complex modules able to communicate over different protocols and deliver highly refined visualizations.
Business Intelligence Tool?
When I was first exposed to R (about 10 years ago) I honestly didn’t know where to start outside of the usual tutorials on ingesting and manipulating data. After trying different packages, I concluded that I may be able to leverage this tool to do just about anything. Testing that hypothesis, I built a data visualization tool for email marketing campaigns, but this wasn’t just for graphs. I found a package that could pull maps from Google Maps based on coordinates and then overlay markers representing customers treated with a campaign. Additionally, different colored markers were added for those who converted in weekly time frames. The final piece was to use an animated GIF program to combine the images for viewing on the web. Again, R is very versatile.
API Integration
Once R was made accessible from T-SQL, it was time to solve a long-standing difficulty I’ve had with data integration. Application Program Interface (API) is everywhere and it’s very common that those who have built one will also engage with it; however, to a database developer, it’s not common at all. If you wanted to get data from an API into the database, you would have to reach out to an application developer using .NET / Java / Python etc. to build a custom interface and deliver the data into the database. So, as fun as that sounds, building a stored procedure to handle it for you is much easier and faster.
Example API XML Integration
The following example shows a simplified approach for building a data integration with an API and parsing it into a table structure. A common architecture would include a web tier, data tier, and multiple people to develop and deploy a solution. However, I’m going to show you a single query that will deliver the current weather report for Grand Blanc, MI into a table.
*NOTE: Before you attempt to use this query, take a moment to review Known Issues for SQL Server R Services. My experience did not go very well until I read the section on “Remote compute contexts blocked by firewall in SQL Server instances running on Azure virtual machines” which also applies to installs on local machines.
*REQUIREMENTS: SQL Server 2016 and access to the machine to install addition R packages. To use the code below, you will need to install the R packages “xml2” and “XML”. Instructions on the procedure can be found here. The API used is free with registration which is required to get an API key to access the data and can be found here.
The code is broken up into 3 parts, first declaring variables, like so:
DECLARE @Rscript NVARCHAR(MAX),
@API_URL NVARCHAR(MAX)
Next, we need to assign our API URL to a variable and the R code necessary to call and parse the data. Your code might look something like this:
SET @API_URL = 'http://api.openweathermap.org/data/2.5/weather?zip=48439,us&APPID=&mode=xml'
SET @Rscript = N'library(xml2);library(XML);
weather.doc <- read_xml("'+@API_URL+'");
weather.xml <- xmlRoot(xmlParse(weather.doc));
city.id <- xpathSApply(weather.xml, "//*/city", xmlGetAttr, "id", NA);
city.name <- xpathSApply(weather.xml, "//*/city", xmlGetAttr, "name", NA);
city.lon <- xpathSApply(weather.xml, "//*/city/coord", xmlGetAttr, "lon", NA);
city.lat <- xpathSApply(weather.xml, "//*/city/coord", xmlGetAttr, "lat", NA);
city.country <- xmlToDataFrame(getNodeSet(weather.xml, "//*/city/country"));
city.sun.rise <- xpathSApply(weather.xml, "//*/city/sun", xmlGetAttr, "rise", NA);
city.sun.set <- xpathSApply(weather.xml, "//*/city/sun", xmlGetAttr, "set", NA);
temp <- xpathSApply(weather.xml, "//*/temperature", xmlGetAttr, "value", NA);
temp.min <- xpathSApply(weather.xml, "//*/temperature", xmlGetAttr, "min", NA);
temp.max <- xpathSApply(weather.xml, "//*/temperature", xmlGetAttr, "max", NA);
temp.unit <- xpathSApply(weather.xml, "//*/temperature", xmlGetAttr, "unit", NA);
humidity <- xpathSApply(weather.xml, "//*/humidity", xmlGetAttr, "value", NA);
humidity.unit <- xpathSApply(weather.xml, "//*/humidity", xmlGetAttr, "unit", NA);
pressure <- xpathSApply(weather.xml, "//*/pressure", xmlGetAttr, "value", NA);
pressure.unit <- xpathSApply(weather.xml, "//*/pressure", xmlGetAttr, "unit", NA);
wind.speed <- xpathSApply(weather.xml, "//*/wind/speed", xmlGetAttr, "value", NA);
wind.speedname <- xpathSApply(weather.xml, "//*/wind/speed", xmlGetAttr, "name", NA);
wind.gusts <- xpathSApply(weather.xml, "//*/wind/gusts", xmlGetAttr, "value", NA);
wind.direction <- xpathSApply(weather.xml, "//*/wind/direction", xmlGetAttr, "value", NA);
wind.directioncode <- xpathSApply(weather.xml, "//*/wind/direction", xmlGetAttr, "code", NA);
wind.directionname <- xpathSApply(weather.xml, "//*/wind/direction", xmlGetAttr, "name", NA);
clouds <- xpathSApply(weather.xml, "//*/clouds", xmlGetAttr, "value", NA);
clouds.name <- xpathSApply(weather.xml, "//*/clouds", xmlGetAttr, "name", NA);
visibility <- xpathSApply(weather.xml, "//*/visibility", xmlGetAttr, "value", NA);
precipitation <- xpathSApply(weather.xml, "//*/precipitation", xmlGetAttr, "mode", NA);
weather.number <- xpathSApply(weather.xml, "//*/weather", xmlGetAttr, "number", NA);
weather.value <- xpathSApply(weather.xml, "//*/weather", xmlGetAttr, "value", NA);
weather.icon <- xpathSApply(weather.xml, "//*/weather", xmlGetAttr, "icon", NA);
lastupdate <- xpathSApply(weather.xml, "//*/lastupdate", xmlGetAttr, "value", NA);
OutputDataSet <- data.frame(city.id, city.name, city.lon, city.lat, city.country, city.sun.rise,
city.sun.set, temp, temp.min, temp.max, temp.unit, humidity, humidity.unit, pressure,
pressure.unit, wind.speed, wind.speedname, wind.gusts, wind.direction, wind.directioncode,
wind.directionname, clouds, clouds.name, visibility, precipitation, weather.number,
weather.value, weather.icon, lastupdate)';
The last step is to execute the R script and define our Result Sets, like so:
EXEC sp_execute_external_script
@language = N'R',
@script = @Rscript
WITH RESULT SETS(([city.id] VARCHAR(100), [city.name] VARCHAR(100), [city.lon] VARCHAR(100),
[city.lat] VARCHAR(100), [city.country] VARCHAR(100), [city.sun.rise] VARCHAR(100),
[city.sun.set] VARCHAR(100), [temp] VARCHAR(100), [temp.min] VARCHAR(100),
[temp.max] VARCHAR(100), [temp.unit] VARCHAR(100), [humidity] VARCHAR(100),
[humidity.unit] VARCHAR(100), [pressure] VARCHAR(100), [pressure.unit] VARCHAR(100),
[wind.speed] VARCHAR(100), [wind.speedname] VARCHAR(100), [wind.gusts] VARCHAR(100),
[wind.direction] VARCHAR(100), [wind.directioncode] VARCHAR(100),
[wind.directionname] VARCHAR(100), [clouds] VARCHAR(100), [clouds.name] VARCHAR(100),
[visibility] VARCHAR(100), [precipitation] VARCHAR(100), [weather.number] VARCHAR(100),
[weather.value] VARCHAR(100), [weather.icon] VARCHAR(100), [lastupdate] VARCHAR(100)))
The R code consists of 5 parts, starting with loading the libraries needed to handle the XML as well as the API call. Curl is the package enabling the communication and will not have to be loaded directly as it gets loaded with the other packages. Here is step 1:
library(xml2);library(XML);
Step 2 makes the API call and reads the XML into a variable:
weather.doc <- read_xml("'+@API_URL+'");
Step 3 parses the XML wrapper and leaves you with the root element and remaining body:
weather.xml <- xmlRoot(xmlParse(weather.doc));
This is the data returned and contained in “weather.xml”:
-
US
-
Step 4 parses each element or attribute of the XML into individual variables:
city.id <- xpathSApply(weather.xml, "//*/city", xmlGetAttr, "id", NA);
city.name <- xpathSApply(weather.xml, "//*/city", xmlGetAttr, "name", NA);
city.lon <- xpathSApply(weather.xml, "//*/city/coord", xmlGetAttr, "lon", NA);
city.lat <- xpathSApply(weather.xml, "//*/city/coord", xmlGetAttr, "lat", NA);
city.country <- xmlToDataFrame(getNodeSet(weather.xml, "//*/city/country"));
Step 5 combines all of the individual data frames into a single data frame using the expected SQL OutDataSet variable, as seen below.
OutputDataSet <- data.frame(city.id, city.name, city.lon, city.lat, city.country, city.sun.rise, city.sun.set, temp, temp.min, temp.max, temp.unit, humidity, humidity.unit, pressure, pressure.unit, wind.speed, wind.speedname, wind.gusts, wind.direction, wind.directioncode, wind.directionname, clouds, clouds.name, visibility, precipitation, weather.number, weather.value, weather.icon, lastupdate)
The below example shows the expected output once executed.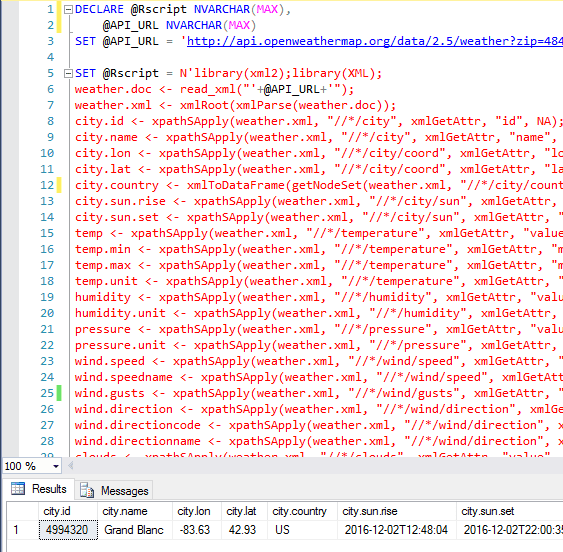
Summary
R will continue to gain popularity in the Data Science field for its ability to model and forecast trends, but I hope to see more database developers start to explore its capabilities. This example was intended to give database developers a bridge between the power of a relational database management system and the exorbitant amount of data available through APIs.
If you’re still looking for more information or need help with Microsoft R, contact BlueGranite today!