
With the advent of Internet of Things (IOT) and the proliferation of connected devices, comes the challenge of monitoring parts for maintenance before they break down. A common approach revolves around getting data from connected devices and performing a statistical test to determine the likelihood of the device failing. While this common approach is robust, it typically involves a significant time investment in exploratory data analysis, feature engineering, training, and testing to build a predictive model. It, therefore, often lacks the agility required to keep up with the monitoring demands of increasingly time-sensitive initiatives.
In this context, the question becomes: how can we ensure a similar degree of rigor, but also improve the timeliness and responsiveness of being able to perform predictive maintenance?

A Simple Approach with CUSUM
CUSUM (short for “Cumulative Sum”) control charts allow us to plot the cumulative deviations of a process from the average, and monitor the results versus the average. Once the cumulative deviations from the average reach a certain threshold, we can then alert users that there has been a change.
More formally, suppose there is a metric that we are monitoring in a stationary process whose high values will result in a part/machine breaking down. We will call the average value of this metric ![]() (mu), and for every observation we will only add positive deviation for the mean. To start, the initial cumulative effect will be 0,
(mu), and for every observation we will only add positive deviation for the mean. To start, the initial cumulative effect will be 0, ![]() . Let T be some threshold value that we want to monitor to see if the cumulative effects go over.
. Let T be some threshold value that we want to monitor to see if the cumulative effects go over.
For every newly observed value ![]() of data, we want to update the cumulative effect as shown. To update for the next S, we take only the positive change, since we’re measuring positive deviation or 0. If we reach the threshold value of T, we alert the user that there has been a change in the process.
of data, we want to update the cumulative effect as shown. To update for the next S, we take only the positive change, since we’re measuring positive deviation or 0. If we reach the threshold value of T, we alert the user that there has been a change in the process.
![]()
Below is a visual representation of CUSUM in the increasing direction, with a threshold of 4 and 5 (SH in this case is the variable we are referring to as T).
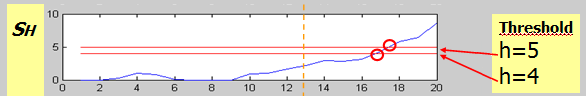
Source.
Azure Stream Analytics & Power BI Streaming Datasets
Azure Stream Analytics is a real-time analytics platform designed to analyze and process large volumes of streaming data from multiple sources simultaneously. The image below highlights a variety of streaming architecture patterns possible in Azure Stream Analytics.
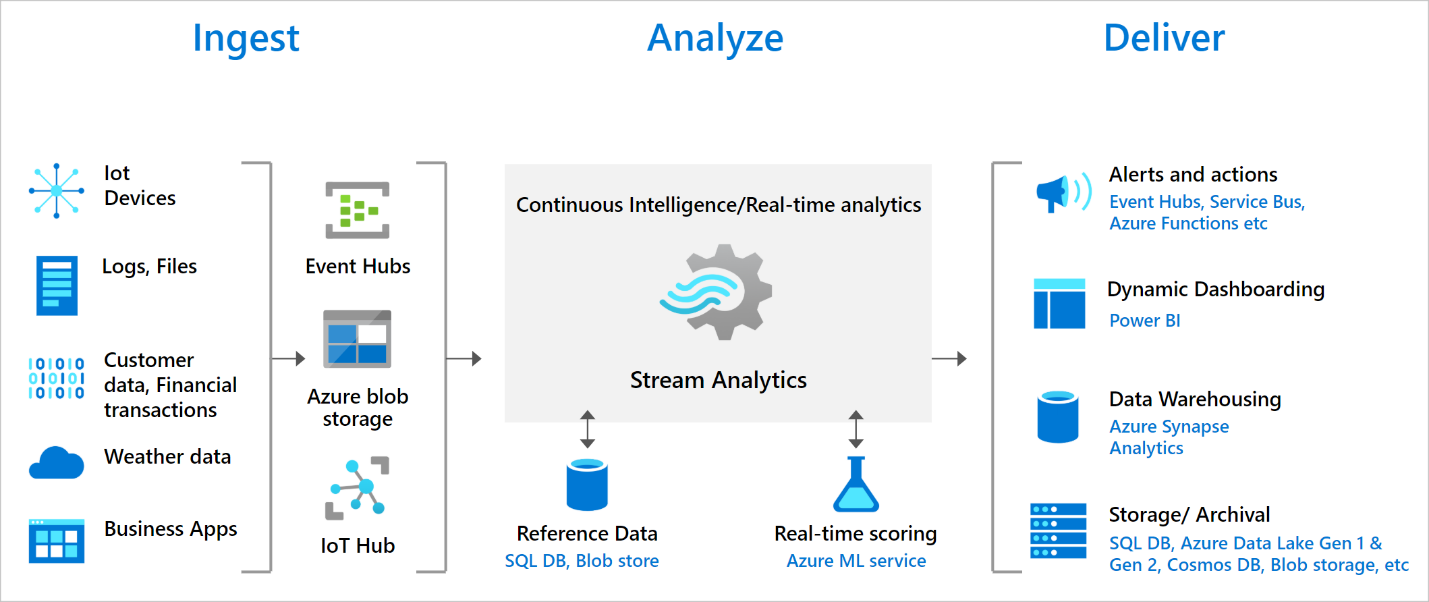
For this demo, we will be using Azure Stream Analytics to process temperature data using CUSUM, and feed the results to a Power BI Report. From there, we will demonstrate how to configure data alerts to notify users when the process changes based on a threshold value T, and to email a notification to them.
Setting Up the Azure Environment
Following this guide, we will set up the following resources beforehand. It is recommended to create a test resource group/environment before proceeding.
- Azure Event Hubs Namespace
- Azure Event Hub
- Azure Stream Analytics Job
- (Optional) Python Jupyter Notebook to send data into the event hub
- Must have the “azure-eventhub” package installed to send events to Stream Analytics
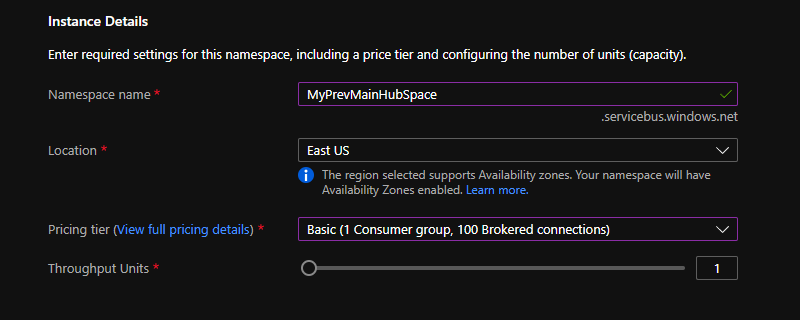
Create Event Hub Namespace. Choose the basic subscription
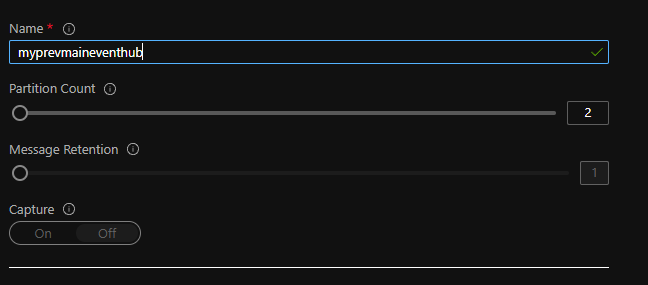
Within the Namespace, Create the EventHub
From here you will need to create a SAS policy and get the connection strings for your application to send data to the event hub.
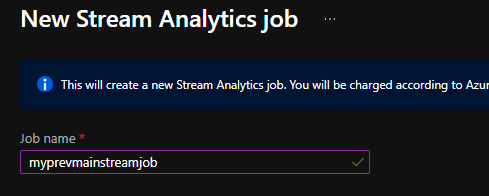
Create an Azure Stream Analytics Job
From here, you can follow the instructions to set up the input stream and output stream in the Topology Section of the Resource. In the output stream, we will be using “My Workspace” as the destination when connecting to Power BI.
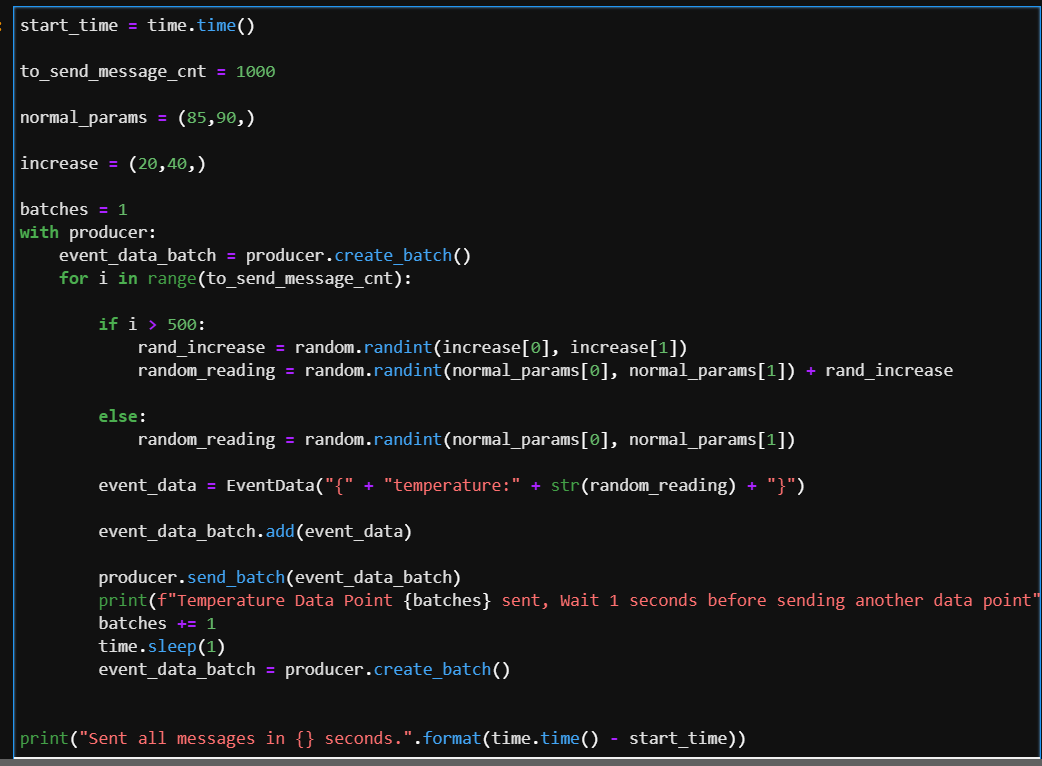
There are multiple ways to send data into the event hub once you have the SAS key. For this example, we’ve created a Python Jupyter Notebook to simulate temperature data being sent by a device/system to the event hub. It will be a simple JSON output that looks like the following. At some point in the event stream process, we will start to increase the random reading by 20 to 40 degrees Fahrenheit to simulate the process going out of control.
“{” + “temperature:” + str(random_reading) + “}”
Setting up the Stream Analytics Query/Job to Output Dataset
We now need to process the data in the event hub. We can do this by going to the query section of Azure Stream Analytics, and creating the query to aggregate our streaming data.
At a high level, the query does the following:
- It will aggregate the total CUSUM for a given 30 second window (we chose 87.5 degrees, as it’s the average value between 85 and 90 in the reading we send), any differences that are negative will be zeroed out
- Add the windowed result set into the dataset in Power BI
- We use a tumbling window to append the data into the dataset
Run the Job and Script to Start Streaming Process
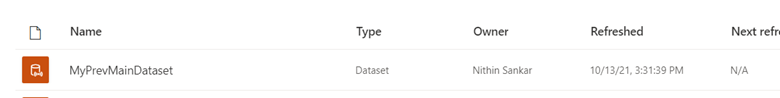
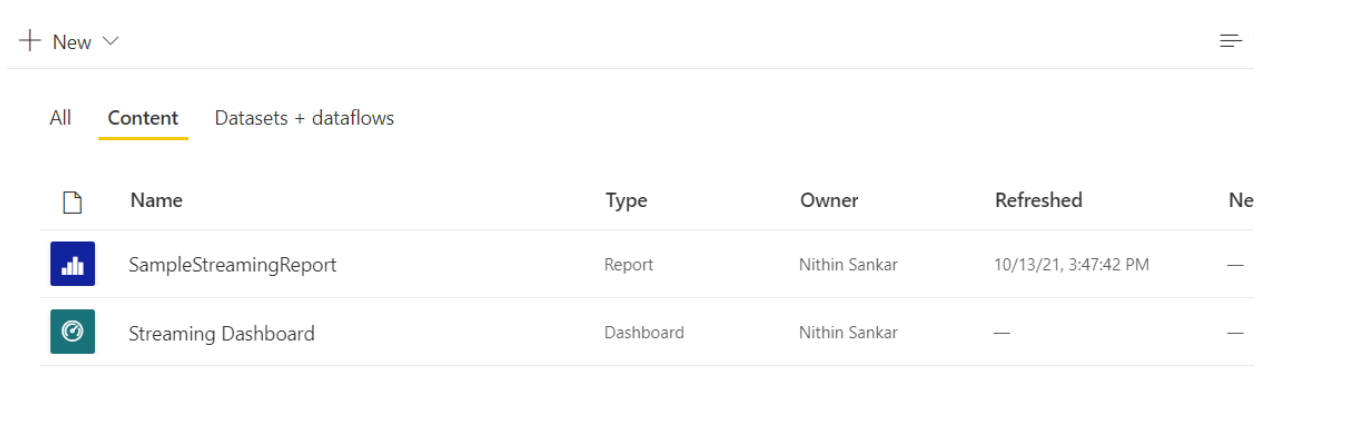
Once ready, we can run all the notebook cells and kickoff the stream analytics job. This will create a streaming dataset in the “My Workspace” area of the Power BI Online Service:
Create Card Visual and Publish the Report
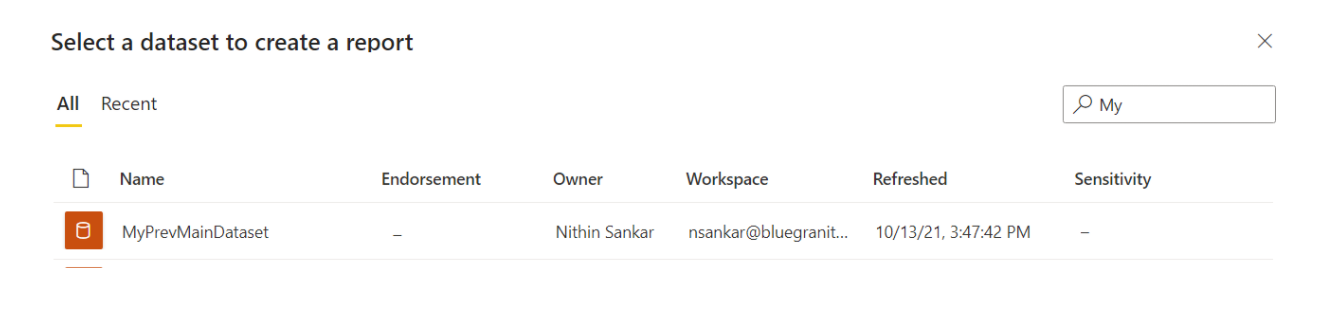
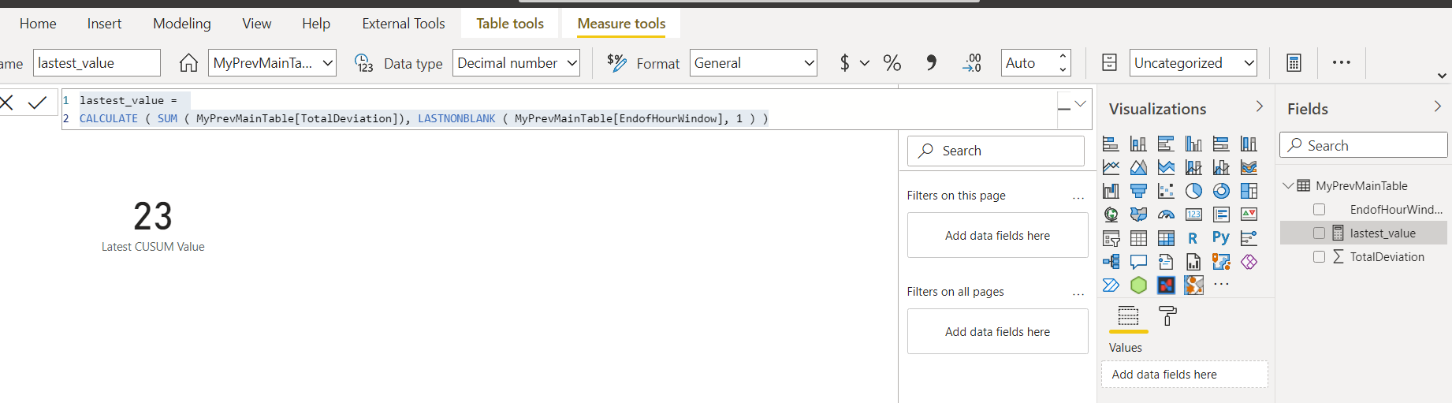
Now, we can open Power BI Desktop and create a Card Visual from the Streaming Dataset. We can do this by importing a Power BI Dataset, and connecting to our streaming dataset:
From there, we create a measure using a simple DAX CALCULATE() function to get the latest value from our streaming dataset to display in the KPI card:
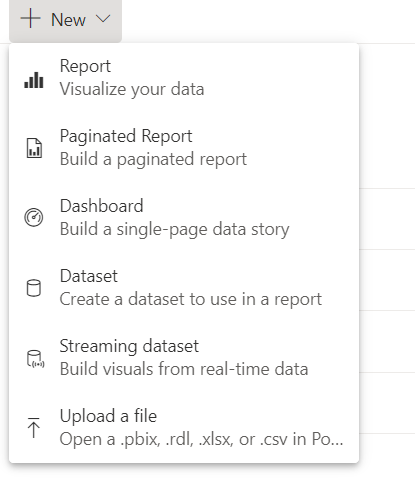
Publish the Report and Create a Dashboard
After publishing our report back to the Power BI Online Service, we can create a dashboard there on which to pin the card. In this example, we’ll call our dashboard “Streaming Dashboard.”
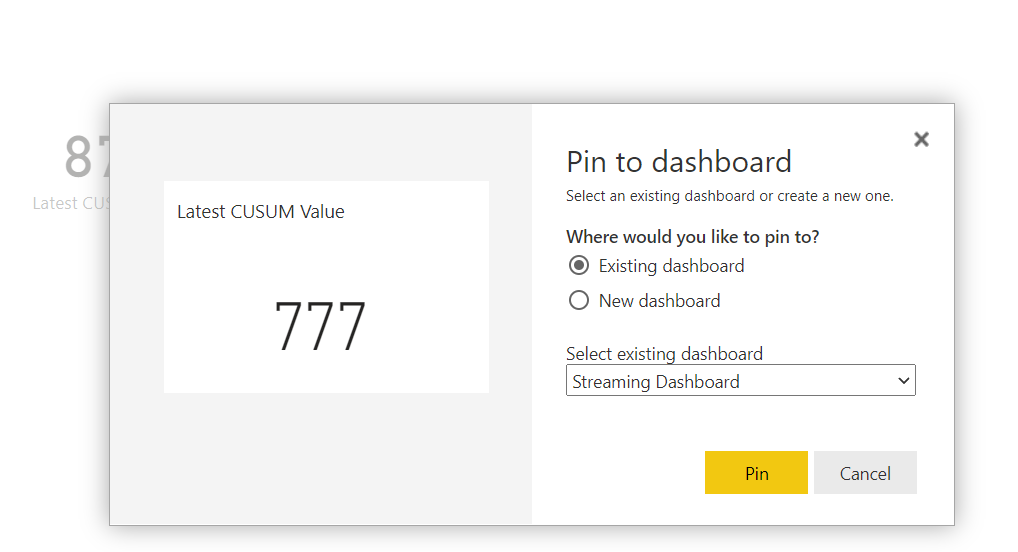
We then navigate to our newly published report in the Service and click on the “pin” icon to pin the card in the report to our dashboard.
When prompted, we’ll select “Streaming Dashboard” as the destination for our pinned visual.
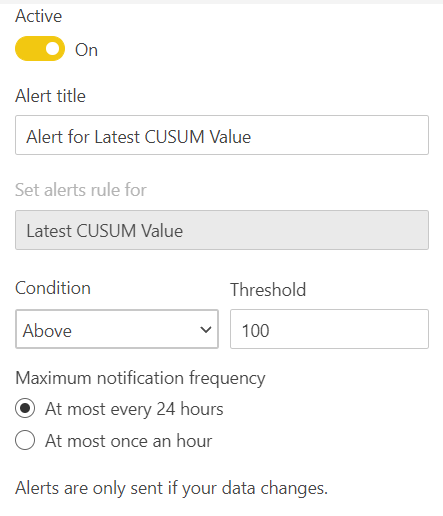
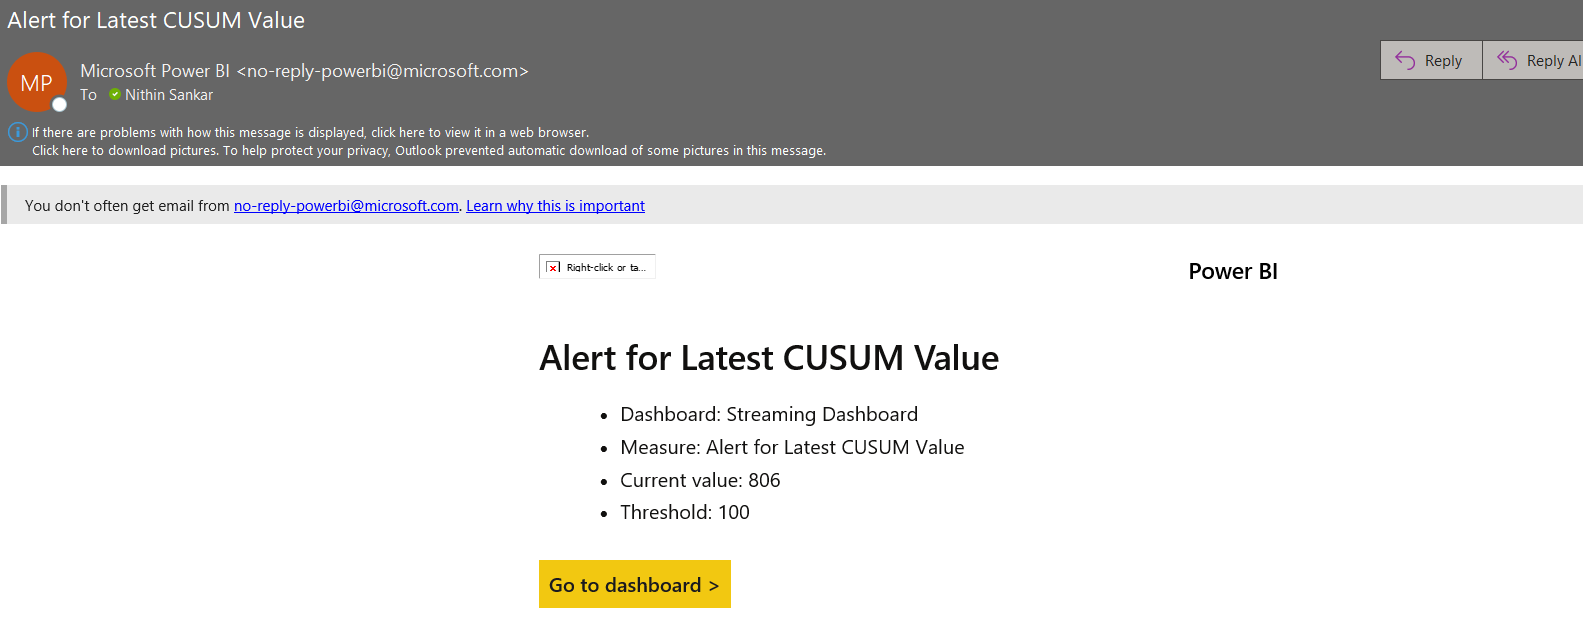
Configure Data Alerts & High-threshold Values Notifications in the Power BI Dashboard Finally, we can set a data alert for when the value in the card exceeds our threshold T. In this example, we set T to be one hundred. If the CUSUM data stream exceeds one hundred within a 30 second interval, we’ll get an email from Power BI, like the one shown below, to alert us that the process could have potentially changed. We also have the option to set notifications to every hour, or once within the 24-hour window.
In Conclusion
If you got this far, congratulations! You have now created a workflow to monitor the temperature of a device in real time, and you’ve used CUSUM to alert you if a device or process is out of control. In applications where time to action is critical, this sample solution provides a way for individuals to take quick and decisive preventative actions.
Additional Considerations:
- There is no hard, fast value for determining a threshold value for T. This is something that will need to be determined through reviewing with business stakeholders and through initial exploratory data analysis of past maintenance issues
- We can manipulate and extend mu, the expected value of the process, to account for cyclical and waveform processes
- You can add a C parameter in the model to change the sensitivity of detecting changes over time. We can modify the equations as follows with the C parameter:

- This approach looked at monitoring values as they increase, but you can also replicate this process to monitor decreases
- Combining this approach with hypothesis testing and modeling can lead to powerful solutions, proactive decision making, and fewer device maintenance issues
- Azure Stream Analytics also provides tools for anomaly detection, and users can leverage those options, as well as the methodology presented here as options to scale your process to meet your needs
We Can Help!
Our data experts can help you learn more about change detection and workflows to show how these tools can greatly improve your overall business outcomes. Contact 3Cloud today.


