
I recently had the pleasure of attending the Artificial Intelligence (AI) & Machine Learning (ML) in Power BI track at the Microsoft Power BI Bootcamp for partners. The two-day track was a deep dive into the various AI and ML capabilities currently available in Power BI. Partner attendees got to share the room with members of the Power BI product team over the two days. It was really fun to be able to hear directly from the team why features were designed a certain way, and even offer up feedback of how we think the platform could be further improved. The Power BI team has been working tirelessly to integrate AI capabilities into traditional BI scenarios. Because Power BI is constantly evolving, it’s easy to miss, or be unaware of, specific features. The goal of this post is to provide a consolidated overview of AI and ML capabilities currently available across the Power BI platform. However, since I don’t claim to be a data scientist, we’re going to focus primarily on features that were developed with the analyst and end user in mind.
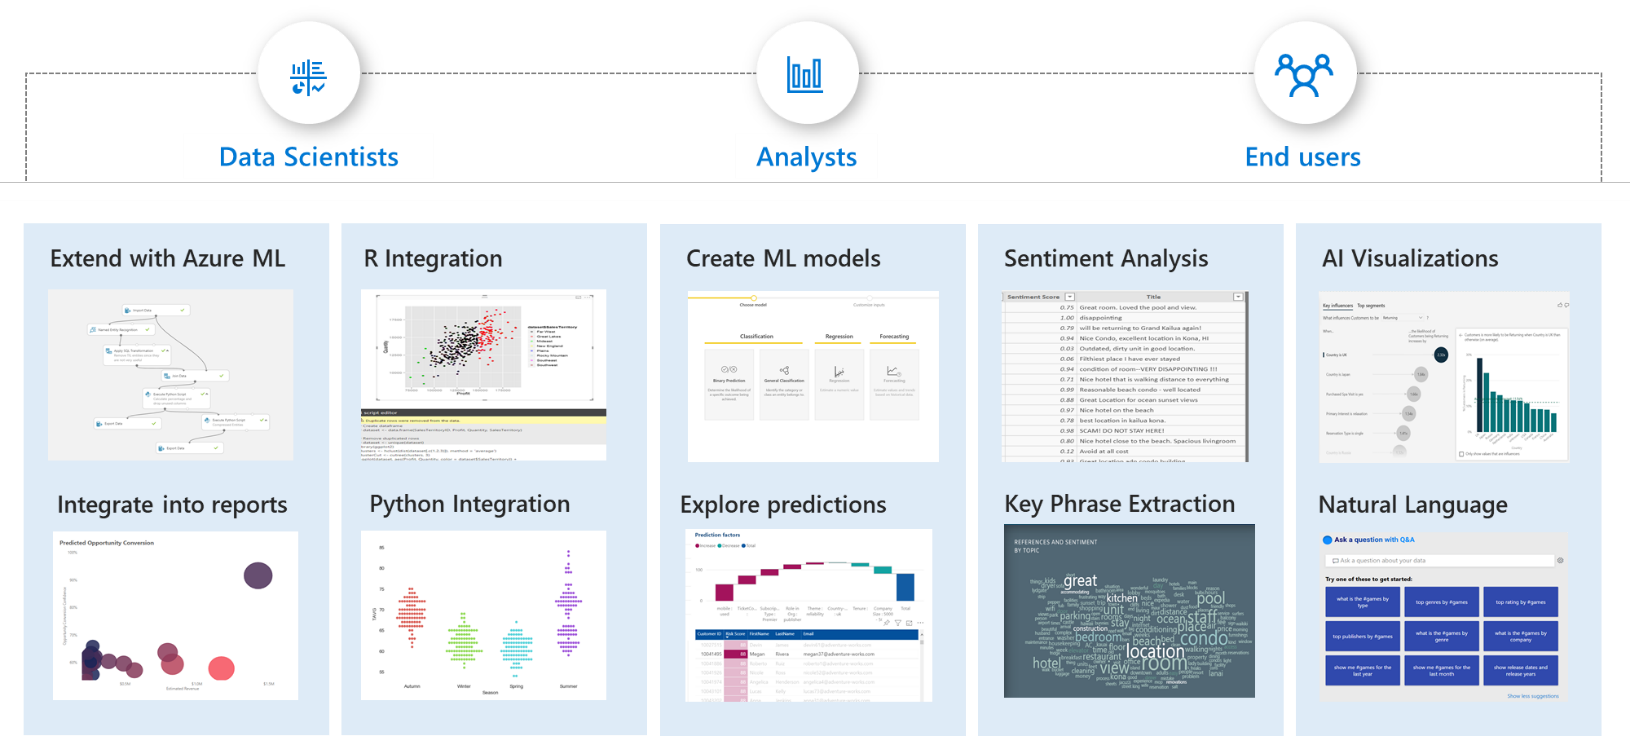
Different personas in Power BI. Data scientists can add Power BI to their tool belt with R, Python, and Azure ML integration. Whereas, BI developers, analysts, and end users can leverage features aimed to improve their analyses. We’re going to focus on these features throughout this post.
The Power BI Platform
Before we dive into specific AI features, let’s take a 50,000-foot view of the complete, end-to-end Power BI platform. Here is a fantastic diagram that displays all of the various components across the Power BI platform. The key takeaway here is that Power BI is much more than a “visualization tool”. Power BI is a mature, modern, enterprise BI platform. Shown below, I took this same diagram, but I wanted to focus on specific areas of the platform where we’ll find unique AI features. In the subsequent sections, we’ll touch on each feature in greater detail.
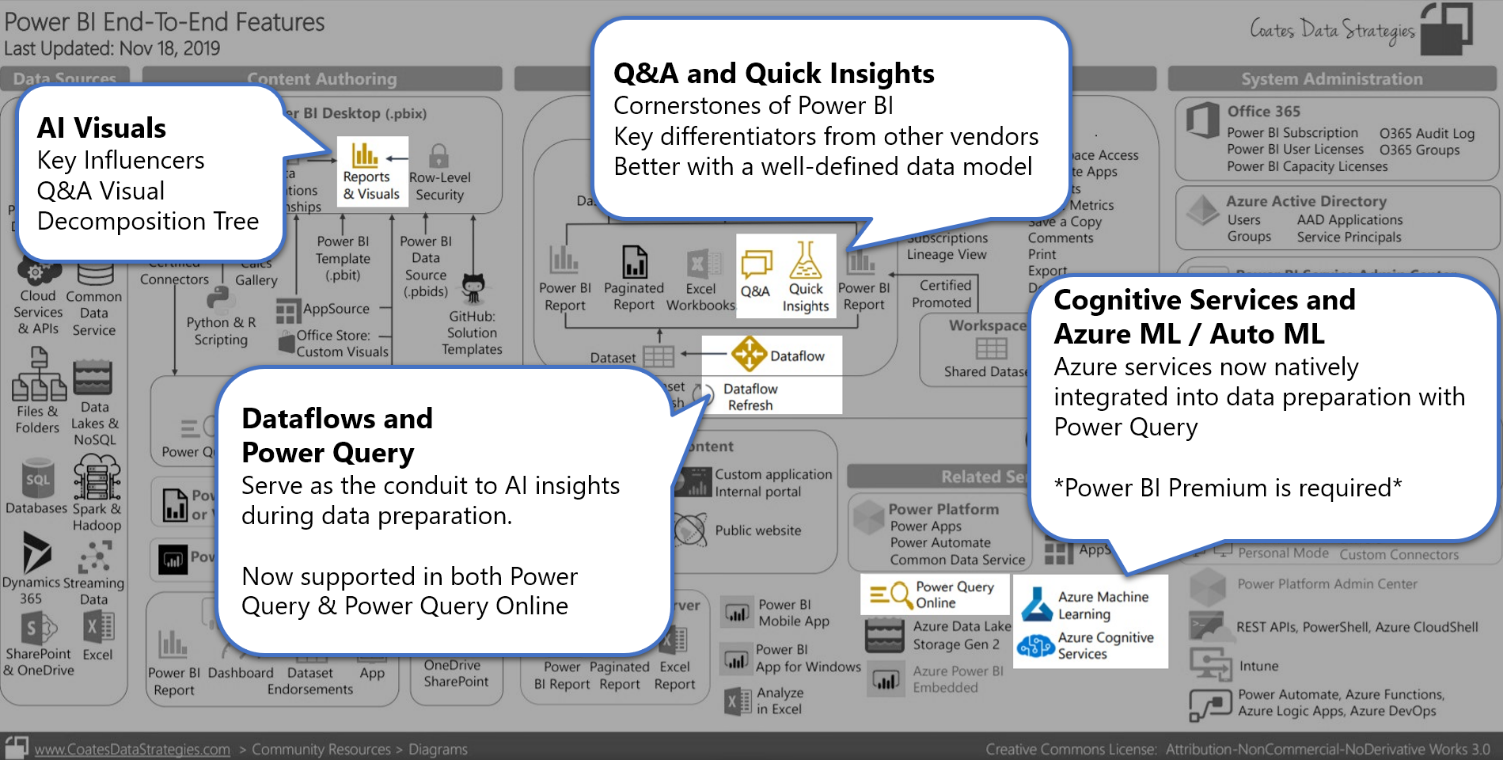
2 – Notice how AI is being integrated into data visualization, data preparation, and data modeling components.
Power BI Components
Conceptually, I like to think of most Power BI authoring components falling into one of three categories:
- Data visualization
- Data preparation
- Data modeling
The Power BI team is investing heavily in incorporating AI capabilities into all three of these categories. We’ll define each category, and the AI features within them, below.
Data Visualization
![]() With Power BI we use visuals to easily interpret and analyze our data. Power BI now contains three explicit AI visuals, which can be identified by the light bulb icon. Additionally, we can also leverage various AI features baked-into traditional visuals, such as bar and column charts.
With Power BI we use visuals to easily interpret and analyze our data. Power BI now contains three explicit AI visuals, which can be identified by the light bulb icon. Additionally, we can also leverage various AI features baked-into traditional visuals, such as bar and column charts.
Decomposition Tree
The Decomposition Tree is the latest AI visualization developed by the Power BI team. This is a highly interactive visual that allows you to decompose (break down) a measure by various attributes across  different dimensions. This visual can be used for ad hoc, exploratory analysis to understand your data. Or, it can be used to perform root-cause analysis, which is enhanced by the built-in AI functionality. For example, when drilling into the tree, you can choose “High value” or “Low value”. Selecting one of these tells the visual to perform an “AI split”, which will then identify the next field to drill into and display the highest or lowest value, respectively. The Decomposition Tree is currently in public preview, so we can expect many enhancements in the coming months.
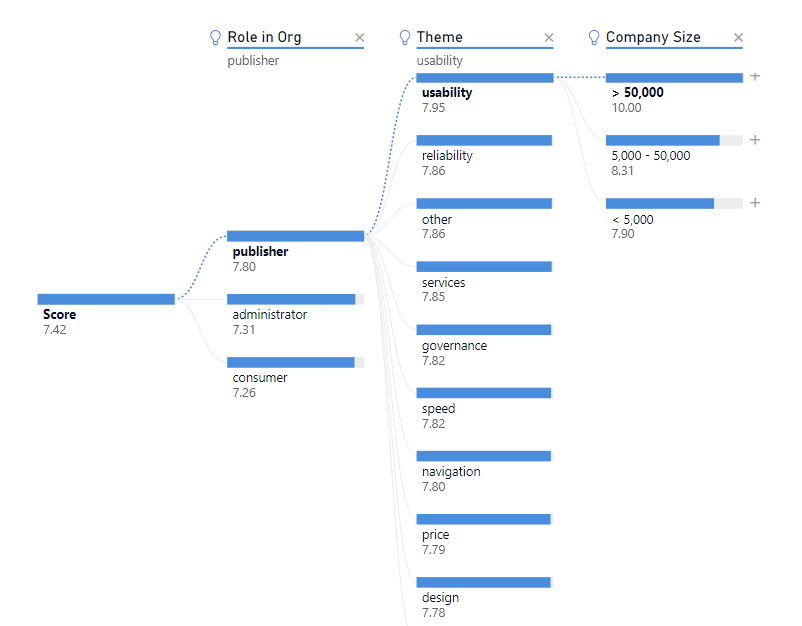
3 – Decomposition Tree is the latest addition to the AI visuals in Power BI. It was one of the most requested features for a long time.
Key Influencers
The Key Influencers visual is a feature that we previously blogged about. Key Influencers is Power BI’s first AI visualization. The visual has seen many improvements since it was initially made available in public preview in February 2019. Key Influencers is a great visual to use when you want to take the guesswork out of analyzing the drivers behind a condition or metric. Check out how we improved our Employee Retention Showcase report to identify the key drivers that affect employee flight risk.
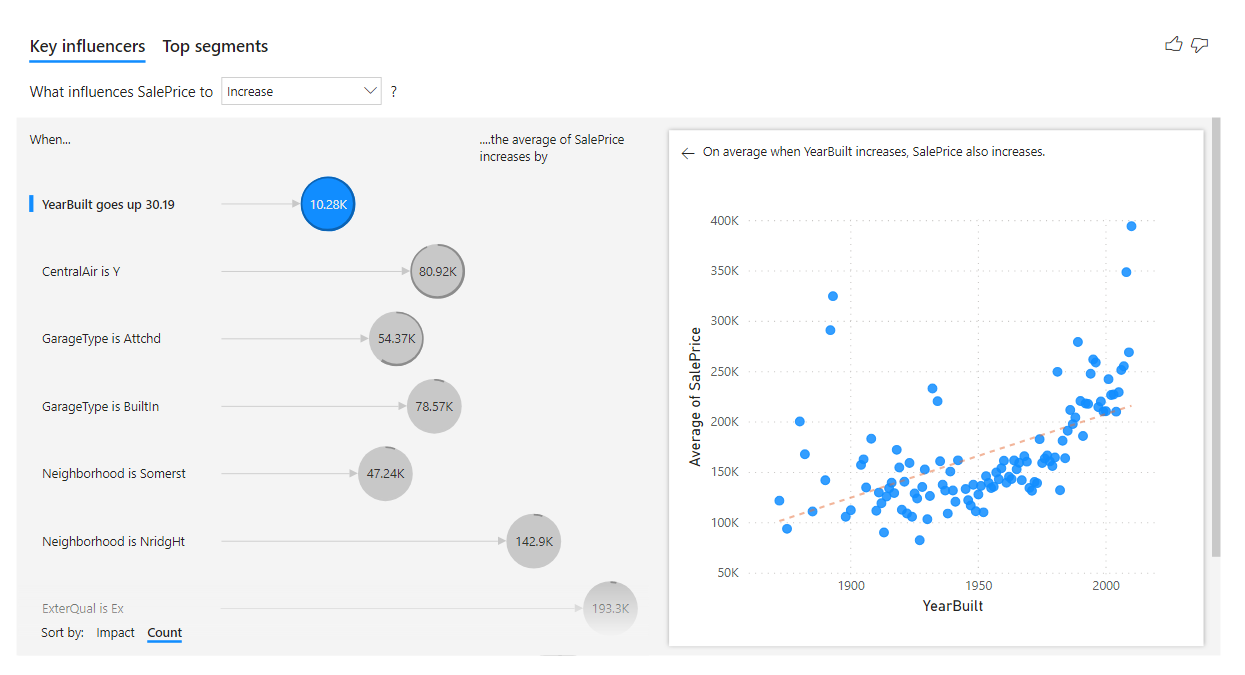
4 – Key Influencers even works on continuous values! Shown above, we’re analyzing what influences home sale price increases in a specific county.
Q&A Visual
The Q&A visual was released in October 2019 as part of the larger Q&A overhaul. Q&A functionality was already available in Power BI reports via a button, but now we have a fully functional visual that behaves and acts like any other visual in Power BI. That means features like applying report themes and cross-filtering will also apply to the new Q&A visual! You can leave the visual in a “Q&A state” so end users can continue to ask their own questions when using your report. Or, if you like a particular visual that was created by asking questions, you can turn the Q&A result into a standard visual by clicking on the icon in the upper right-hand corner.
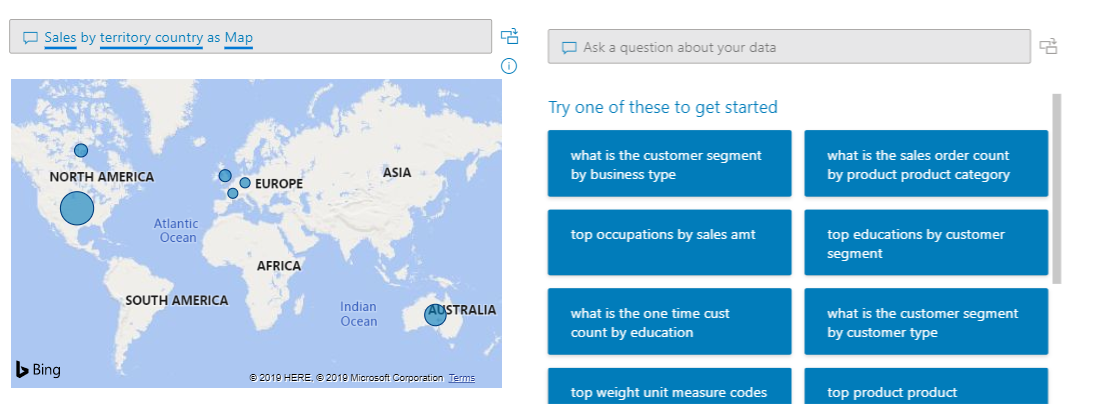 5 – Shown above are two Q&A visuals side-by-side. One has created a map visual for us based on the natural language query. The other has been left in its default state, with some potential suggestions to start your analysis with.
Also released in October 2019, is the Q&A Tooling interface. The new interface allows you to perform tasks such as:
- Reviewing questions users have asked the underlying dataset
- Teaching Q&A to understand questions and terms
- e.g., you can provide translations for both nouns and adjectives
- teaching Q&A terms in the interface will create synonyms behind the scenes
- Managing terms and definitions that you’ve taught Q&A
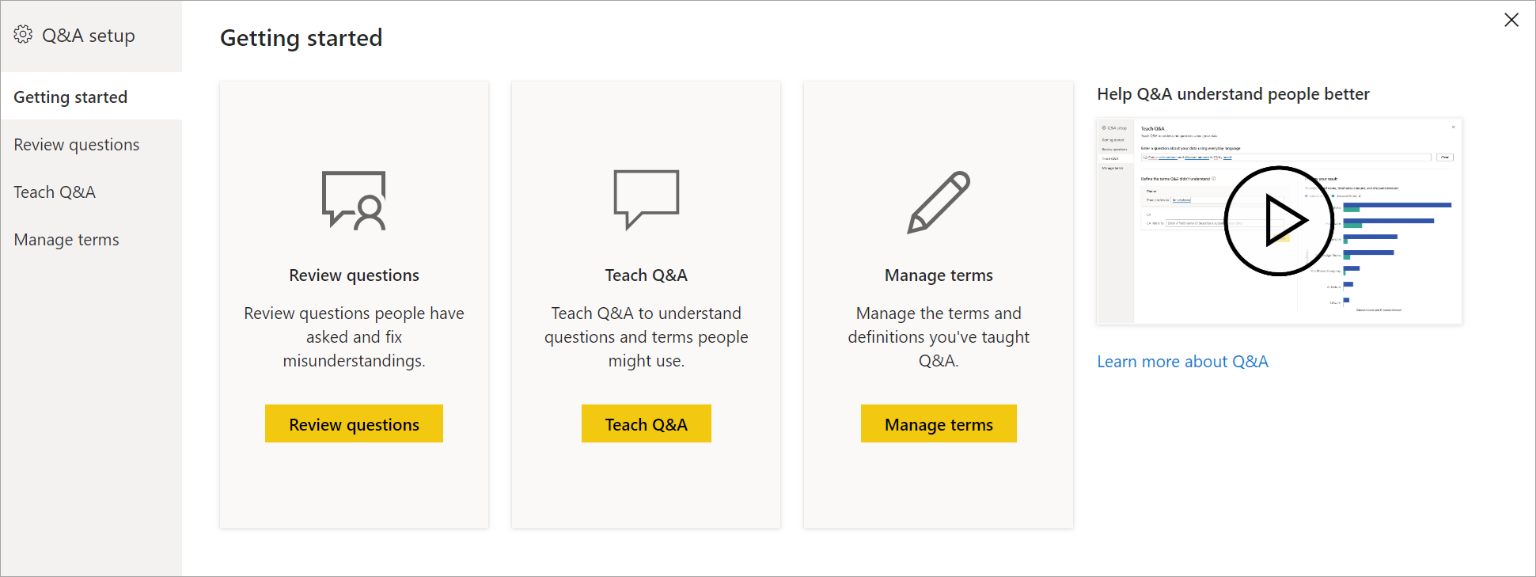
6 – The new Q&A Tooling interface, which is still in public preview.
Insights
The last feature of data visualizations we’ll mention is “Insights” which allows AI-powered analysis within traditional visuals we’re all already familiar with.
This feature can be used to have Power BI identify and explain the increase or decrease between two data points. For example, perhaps you see a large increase in sales between two years. Rather than performing a manual analysis to explain the increase in sales, Power BI can perform that analysis for you!
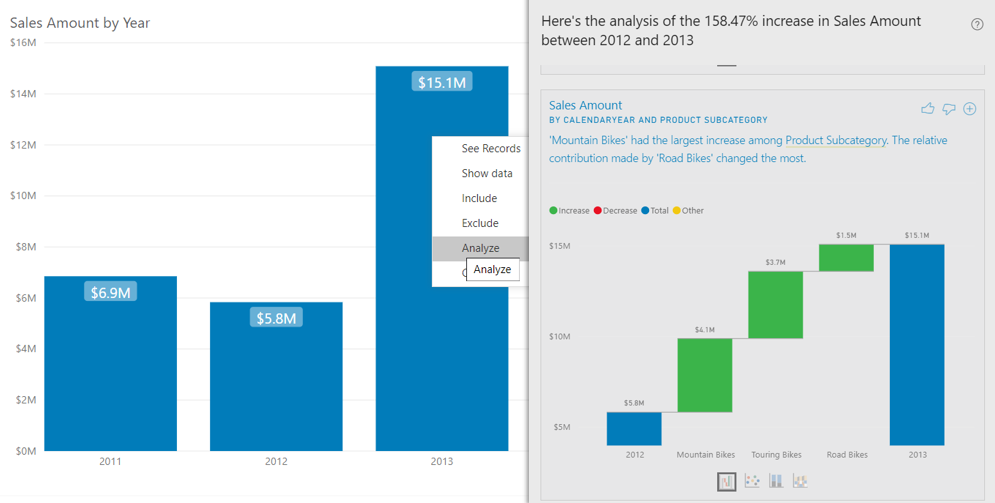
7 – Having Power BI explain the increase in sales between two data points.
Find Where the Distribution is Different
This feature is especially useful if you want to easily identify sub-populations in your dataset where the distribution of data is different from the analysis you performed. This feature takes a lot of the guesswork out of your analysis.
Data Preparation
Data preparation refers to the ETL (extract-transform-load) processes that consolidate, transform, and enrich your dataset. From a Power BI perspective, we’re talking about Power Query within Power BI Desktop, and Power Query Online within Dataflows.
Important: Please note that the features that we’ll discuss in the Data Preparation section all currently require Power BI Premium, and the AI workload enabled within your premium capacity. The reason for this is because Power BI is leveraging Azure services, such as Azure Machine Learning and Azure Cognitive Services, under the hood. You will indirectly pay for these features by purchasing Power BI Premium. Just think of them as another perk of purchasing premium capacity!
Automated Machine Learning (AutoML) in Power BI
AutoML is a feature of Power BI Dataflows that enables users to create, train, and invoke machine learning models. The best part? This is done 100% inside of Power BI! AutoML was designed with the business analyst in mind. I like to refer to AutoML as “Machine Learning with training wheels.” I say that in the most endearing way possible, of course. What I enjoy about AutoML is that it enables business analysts, or even traditional BI developers (like myself), to learn the basics of machine learning, while simultaneously building a model to perform useful predictions.
AutoML is now generally available! It currently supports the creation of Binary Prediction, General Classification, and Regression models. We can expect additional model types, such as Forecasting, in the future. We can also expect the ability to export ML models created in Power BI to Jupyter Notebooks in the future. This could be especially useful for analysts, or developers who want to prototype functionality in Power BI, but then hand it off to a data scientist to really refine and standardize the model.
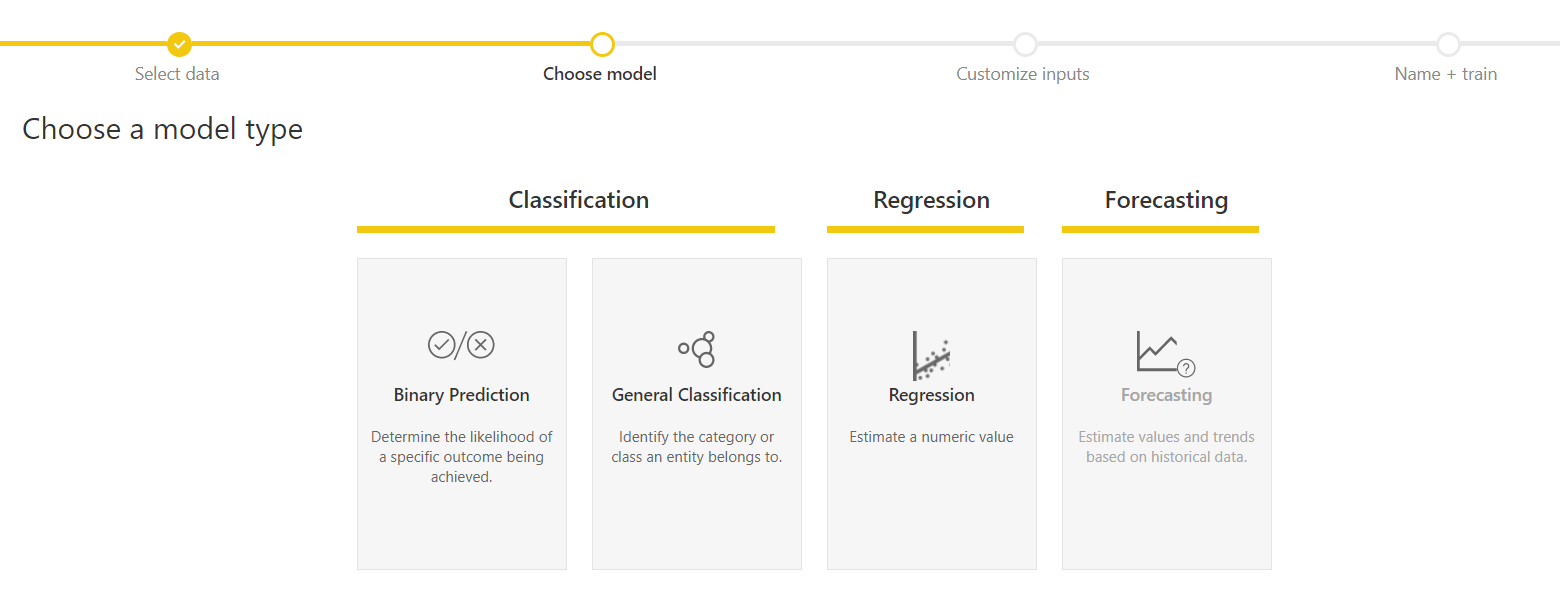
8 – You create ML models within a dataflow. The model is 100% developed within Power BI.
Cognitive Services
Within Power Query, we can enrich our dataset with prebuilt-AI functions from Cognitive Services. The Cognitive Services functions available to us in Power Query are features that David Eldersveld previously blogged about. The four functions currently available are extremely easy to use and can provide additional insights in a matter of seconds. In addition to what David previously blogged about, we can now also access these functions in Power Query within Power BI Desktop!
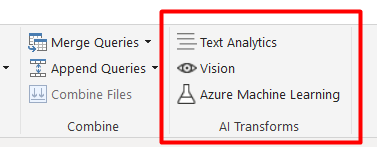
9 – A look at the new “AI Transforms” section in the Power Query ribbon within Power BI Desktop. You’ll still have to log in with an account that has access to a Power BI Premium capacity for this to work.
A great use case for these functions is to perform text analytics. Examples include leveraging functions that enable sentiment scoring and key phrase extraction on text data, such as:
- User reviews
- Social media feedback
- Every line spoken from your favorite TV show
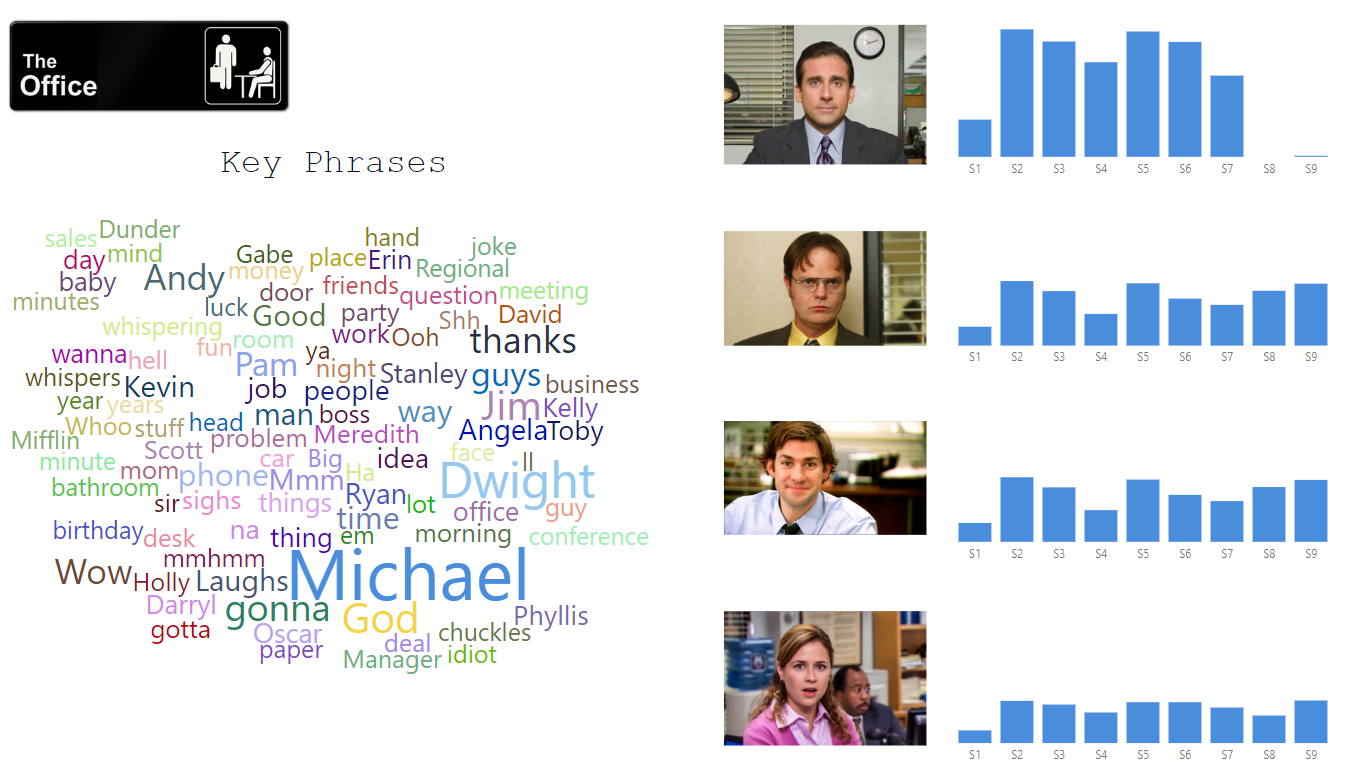
10 – Key phrases, from our friends at Dunder Mifflin!
Data Modeling
Data modeling in Power BI is the process of designing in-memory, enterprise grade, semantic models. In layman’s terms, it allows you to build an experience that enables analysts to build their own reports on top of the model. A well-defined data model also allows Power BI to easily auto-generate insights for you, via features like Q&A and Quick Insights.
Q&A
Q&A allows users to ask natural language questions against their data model. Q&A has long been a selling point of the Power BI Service, as it has served as a key differentiator when compared to other vendor BI platforms. Q&A functionality recently underwent major improvements that became available in the October 2019 Power BI release. We already mentioned the new Q&A visual and Tooling Interface above.
Quick Insights
Quick Insights is probably the simplest AI feature to leverage in Power BI. It literally involves clicking on your dataset and selecting “Get quick insights”. Power BI will then run various algorithms to search for, and identify, trends in your data. This is the part where having a well-designed data model will help Quick Insights yield more useful results. Once Quick Insights has completed its algorithms, you can click “View Insights” and determine if you would like to keep any of the visuals provided by pinning them to a dashboard.
Reach out to us!
Are you excited about any of the features mentioned above, but aren’t quite sure where to start? Reach out! If you want to know more about artificial intelligence capabilities in Power BI or Azure, BlueGranite provides services across Microsoft’s Modern BI, AI, and Data Platform tools. Contact us today!


