On a recent project, we had a request to build operational reports with a cube. The reports had one measure and a bunch of attributes and slicers. A typical pivot report wouldn’t have thousands of rows, but these did. At first, we pointed Excel to the cube and the report would take 20-30 seconds to refresh. The client wasn’t impressed with the performance so we started thinking of different ways to improve the experience.
In Excel, when you create a pivot table from a SQL Server Analysis Services Tabular model, Excel tries to write its own MDX to return the data. Usually, that MDX is not the optimal MDX but it gets the job done. We found you can’t control Excel but you can control the query that Excel runs. By optimizing the query, you can make Excel generate faster pivot reports.
I used SQL Profiler to trace only the start and end of the queries (turning everything else off). Connected to the AdventureWorks Tabular model, I created a quick pivot table to demo the behavior.
Notice I have one measure with many attributes and a few slicers, nothing crazy. This query is a little slow, but not too bad since the model doesn’t have a ton of data (our client’s data had a billion products).
I turned on SQL Profiler first and selected a few values from the slicer. Then I went back to SQL Profiler to see what the trace picked up. You will see some queries have a longer duration than others. I usually find the query that has the longest duration and start my detective work with that one.
Since the MDX here isn’t easy to read, I use a MDX formatter online (http://mdxquery.com/mdx/).
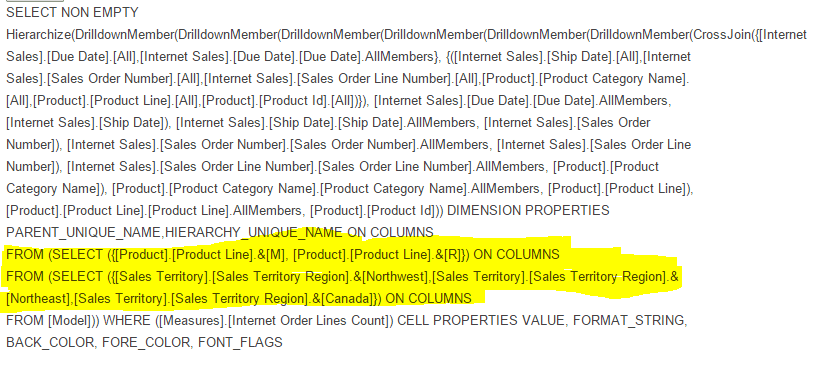
Notice how the MDX generated by Excel writes a query for each slicer you use. This is not optimal! We can do better than that! So, let me show you option two, where we use filters instead of slicers.
Option 2:
I removed the slicers and added in filters with the same values selected. I turn the profiler trace back on and refresh the report. This time the duration is only 531 (milliseconds?) It’s faster than the slicer method, but don’t always rely on the duration. Often, other queries running on the same server can cause the duration to be unreliable, so look at the query too! It’s best to benchmark when less people are using the system.
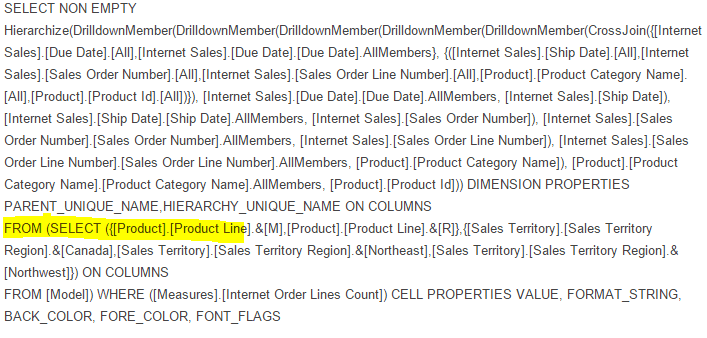
When using filters, MDX only uses one query for all the different fields you are filtering with.
Here, the query only needs to go back to the server once. As you saw above, the more slicers you use, the more times the query has to go back to the server.
So now you see the difference between using slicers and filters, but that still didn’t solve our problem. Our reports were still slow and our clients were still not satisfied. We can’t change the queries that Excel generates, but we can change the query that Excel runs!
Option 3:
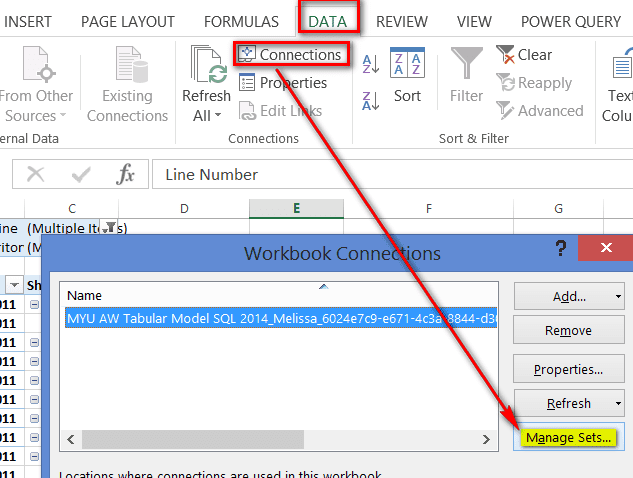
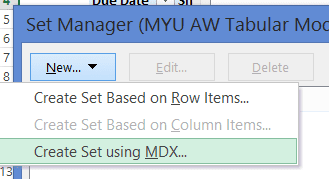
Creating an MDX set in Excel helps control the MDX query. You can go to Data, Connections, Manage Sets and select New, then Create Set using MDX. Build your MDX query here and click OK to save.
Notice you lose the ability to filter by columns, and you get an extra column added for each measure name. Although this option may generate data faster, it’s not the approach we took because the results were too static. The user wanted something more interactive.
Option 4:
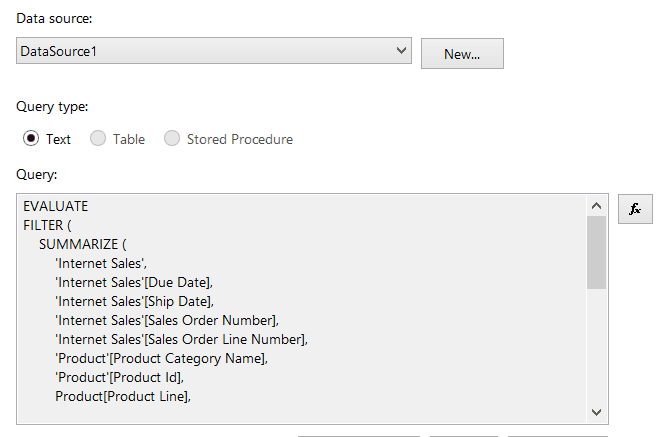
For Option 4 and Option 6, I’ll use the same DAX query:
EVALUATE
FILTER (
SUMMARIZE (
‘Internet Sales’,
‘Internet Sales'[Due Date],
‘Internet Sales'[Ship Date],
‘Internet Sales'[Sales Order Number],
‘Internet Sales'[Sales Order Line Number],
‘Product'[Product Category Name],
‘Product'[Product Id],
Product[Product Line],
‘Sales Territory'[Sales Territory Region],
“Order Line Count”, [Internet Order Lines Count]
),
AND (
OR (
Product[Product Line] = “R“,
Product[Product Line] = “M”
),
OR (
OR (
‘Sales Territory'[Sales Territory Region] = “Northeast”,
‘Sales Territory'[Sales Territory Region] = “Canada”
),
‘Sales Territory'[Sales Territory Region] = “Northwest”
)
)
)
First, it’s good to write the query to test out the performance in SQL Profiler. It’s best to group the fields that belong to the same table together for better performance. This is true for DAX and MDX.
Notice how all the Internet Sales fields are together followed by the Product fields, etc.
Using profiler, you can see the duration of this query is much lower than that of the MDX queries generated by Excel.
So back to Option 4, using the ODC with DAX query…
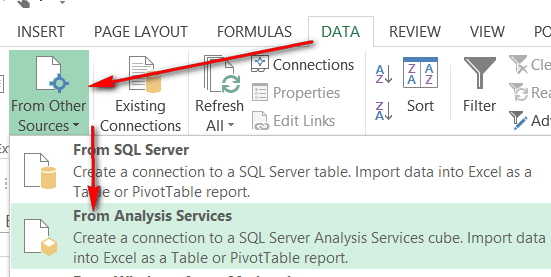
First, create a data connection to your cube.
Select server and model that your data is in and click Finish.
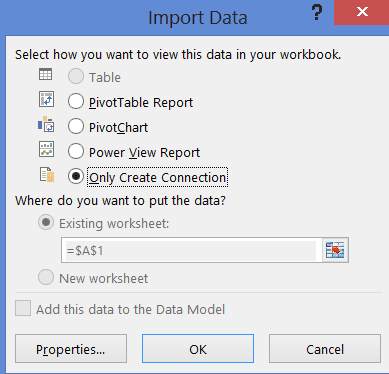
In the Import Data screen select the Only Create Connection option and click OK.
Now go into your “My Data Sources” folder and look for your connection. This folder is usually under your “My Documents” folder.
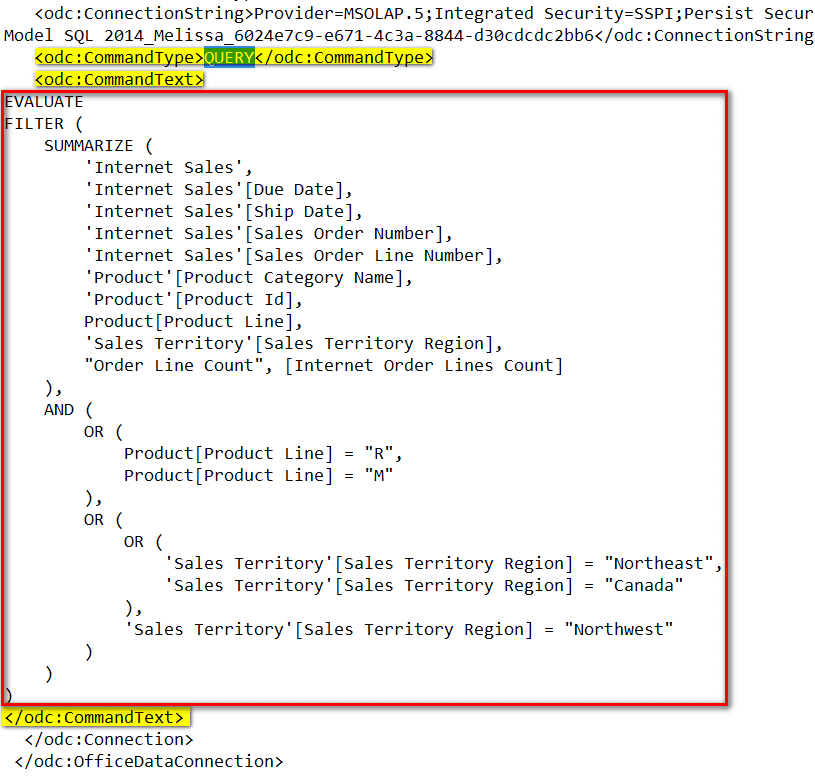
Open your connection with any text editor, here I’m using Notepad. You will see the CommandType line and a CommandText line. Update CommandType from “Cube” to “Query” and paste in the DAX query in the CommandText line. Save the file.
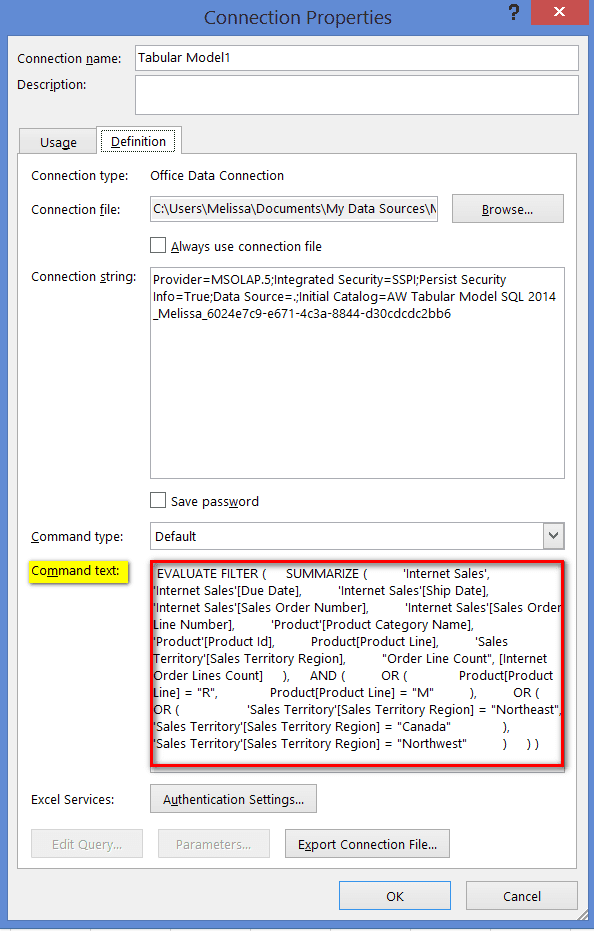
Once the file is saved, open Excel and browse to your new connection file under “Existing Connections.” When the connection opens, you have a Usage tab and a Definition tab. In the Definition tab, you will see the Command Text box with your DAX query. This is where you will edit the DAX query from now on. It’s best to use DAX Studio to build the query and paste it into this box when the query is parsed. Before clicking OK, turn on the profiler if you want to see the difference in performance.
Notice the profiler duration is much faster than the previous queries. So, what’s the difference? Here we are using DAX to query a tabular model. DAX is a language that’s native to tabular so it naturally runs better. Also, we formatted the DAX query so it runs optimally. You can’t do that with the MDX code that Excel generates. Using DAX in these situations is a big advantage.
Options 5 and 6:
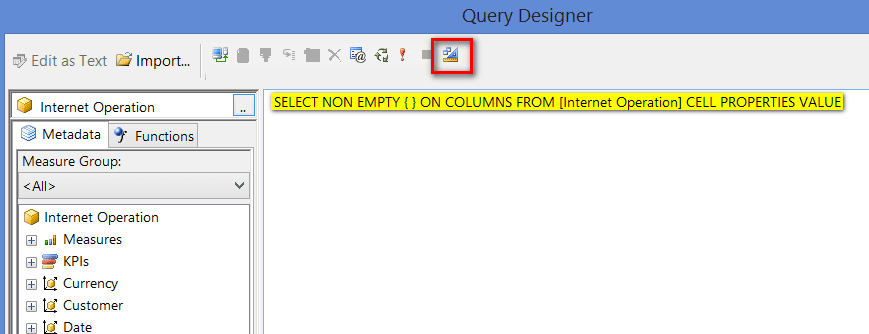
You can use SSRS to export to create a pivot in MDX or DAX. When you use MDX, go to SSRS and create the Data Connection to the tabular model and then create the Data Set. Edit the data set and click on the Design Mode button on the upper right of the Query Designer screen. You will now see an MDX query in the window and you can start writing your MDX query here.
For Option 6, when you use DAX, you paste the DAX query into the query window of the data set. This is a little different from SQL 2012, where you would use the Designer window.
The only thing to be aware of in options 5 and 6 is the parameters. Each parameter must have a separate data set.
To find the best solution, use SQL Profiler to trace your queries, and see what the report is actually trying to do. Sometimes, two solutions may generate the report at the same speed, and you can use profiler to determine which one is actually more optimal. For our report, we found option four was best.
Don’t settle for slow reports. Try to think of different ways you can improve performance. Figure out what your report is really doing. By understanding what your report is doing, you can find an option that works for you.


