
Since the time Power BI became more widely available in mid-2015, Microsoft has relentlessly continued to add new features every month. Microsoft’s vision and execution was appropriately recognized by Gartner in February 2017 and rewarded with the Leader position in the Magic Quadrant for Business Intelligence and Analytics Platforms. While there has been no lapse in new technical components for improving Power BI, the last couple of months have been exceptionally good in terms of features that will improve the adoption of self-service business intelligence. In this article, we’ll review 5 new features that I believe are game changers in improving self-service adoption rates.

1. Connecting to datasets in Power BI Service from Desktop
In the April 2017 update of Power BI Desktop, Microsoft released the ability to connect to datasets in the Power BI service. This is very significant because it helps keep the pristine data model in one place as well as gives users the ability to create reports on top of their data without touching the original data model.
To get a better idea of this new feature, let’s look at the old scenario before this update was released. As an example, let’s say we have a Power User – Zach, in the sales department, who is well versed with Data Analysis Expressions (DAX) and creating data models. Zach took data from different sources and included DAX calculations within his reports to satisfy some common requirements from users, then published the Power BI file.
Another user – Miranda, usually just consumes reports but occasionally needs to create new reports based on changing requirements. Miranda does not know DAX and creates new reports based on the existing data model that Zach provided to her (note: creating reports in Power BI is mostly ‘drag and drop’ and hence has a very minimal learning curve, while DAX requires a bit more expertise). In this situation, Miranda does not have editing rights to the original Power BI file and she would need to save a copy of the file to make her changes. The problem with this approach is that the copies quickly get out of sync with the original Power BI file and become inaccurate – if Zach discovered a metric that he created was using the wrong logic and made an update in the original, Miranda’s copy will be out of sync and she wouldn’t get notified of the issue.
With the new update, Miranda can create reports based on the original Power BI file and all changes made by Zach will automatically be reflected in Miranda’s reports. You can read more about this feature here.
2. Report level measures for live connections to Power BI Service datasets & SSAS tabular models
In the May 2017 update for Power BI Desktop, Microsoft released the ability to create new DAX measures for live connections to a tabular Analysis Services server or a Power BI service dataset. This feature is huge in terms of accelerating adoption across organizations because it encourages users to improve their Power BI skills as well as makes the maintenance of Power BI reports much simpler.
Thinking back to our example above, let’s assume that Miranda has been using Zach’s model for some time and she is slowly improving her DAX and Power BI skills. At this point, she feels comfortable creating simple DAX measures but doesn’t want to recreate all of Zach’s work when creating her own model. Previously, Miranda would have had to save a copy of Zach’s file and add a new measure, or ask Zach to create the measure for her. Now she can add the new measure directly to her report and keep it linked to the original model. The new measure will only be available in Miranda’s reports, so Zach will not have to worry about seeing random measures in his original model. If you want some more information on this update, check out this link.
3. Quick Measures for common calculations
Starting with the April 2017 update of Power BI Desktop, Power BI can now use Quick Measures to quickly and easily perform common, powerful calculations. Using a dialog box, users can select common calculations like aggregates, time-intelligence based functions, running totals, etc. and Power BI will generate the DAX calculations behind the scenes, shown below.
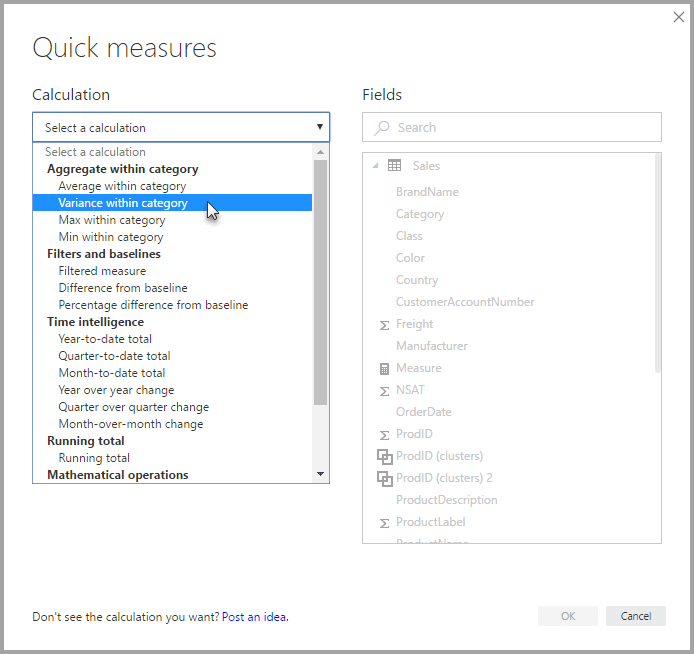
This feature will enable users with minimal knowledge of DAX to create powerful calculations with much less effort. Users can also take advantage of this functionality to jump-start or expand their DAX knowledge as they can see the DAX generated for the calculation. In the scenario mentioned above, a user like Miranda will be much more comfortable creating calculations such as quarter-to-date, running totals, etc. with this technique, and she will easily be able to add it to her report. Viewing the calculations will also aid Miranda in understanding DAX in general. You can find more about this new feature here.
4. Easily distribute dashboards and reports to large audiences with Power BI apps
As of May 2017, Microsoft released a preview version of Power BI apps, which enables organizations to easily deploy a collection of purpose-built dashboards and reports to a large number of business users and empower them to make data-driven decisions. With the earlier version, it was difficult to share and maintain permissions of multiple dashboards within the same set of users.
Now, with Power BI apps, business users can easily install these apps from Microsoft AppSource and access them via a web portal or their iOS, Android, or Windows devices. Users can easily find and return to the content since it’s all in one place. Power Users (like Zach) can update and delete dashboards, then push out their updates to end users by re-publishing the app. Microsoft is also planning to add more features to Power BI apps like directly pushing apps to end users through alerts, email subscriptions, external sharing using AAD B2B, etc. For more information, check out this article.
5. Easier access to critical intelligence with Power BI Premium
Additionally in the May 2017 update, Microsoft announced a new way of licensing Power BI. Power BI Premium builds on the existing Power BI portfolio with a capacity-based licensing model that increases flexibility for how users access, share, and distribute content. The new offering also delivers additional scalability and performance to the Power BI service. The existing method of licensing (Power BI Pro, roughly $10 per user per month) works well for small to medium companies but can be quite expensive for larger organizations. With Power BI premium, cost is based on capacity, so organizations will only have to pay for what they use. Power BI Premium also introduces the ability to maintain BI assets on-premises with Power BI Report Server. Find out more about this change in this whitepaper from Microsoft.
All in all, the recent updates to Power BI are proving to be very useful and should continue to improve over time. If you have any questions or want to know more about how your organization can utilize Power BI, contact us!


