Introduction
In a previous blog post, we discussed the benefits of integrating Microsoft Power BI and Azure Synapse Analytics. The advantages of combining the two services are nearly endless. Using both Synapse and Power BI enriches every stage of the data lifecycle, from data ingestion and exploration to reporting. Thankfully, the process of integrating the two services is seamless. This blog post will walk you through an example scenario of linking PBI and Synapse workspaces to kickstart your advanced analytic journey.
Prerequisites
- A destination Power BI workspace must exist, or you must create one.
- The account connecting to Power BI must have permission to access the workspace.
- The Azure tenant for the Synapse workspace and the Microsoft tenant for the Power BI workspace must be the same.
- You must add the Power BI workspace as a Linked Service to be able to connect datasets between the two services.
Tutorial
The overall process is that you establish a connection between the Azure Synapse workspace and the Power BI workspace. Then, you can Link a PBI Workspace to Synapse to connect datasets between the workspaces and build reports either directly in Synapse Studio or using Power BI.
To start, go to the Azure Portal and navigate to the Synapse resource. Open Synapse Studio.
Getting Started
Go to the Manage tab > Linked Services > New.
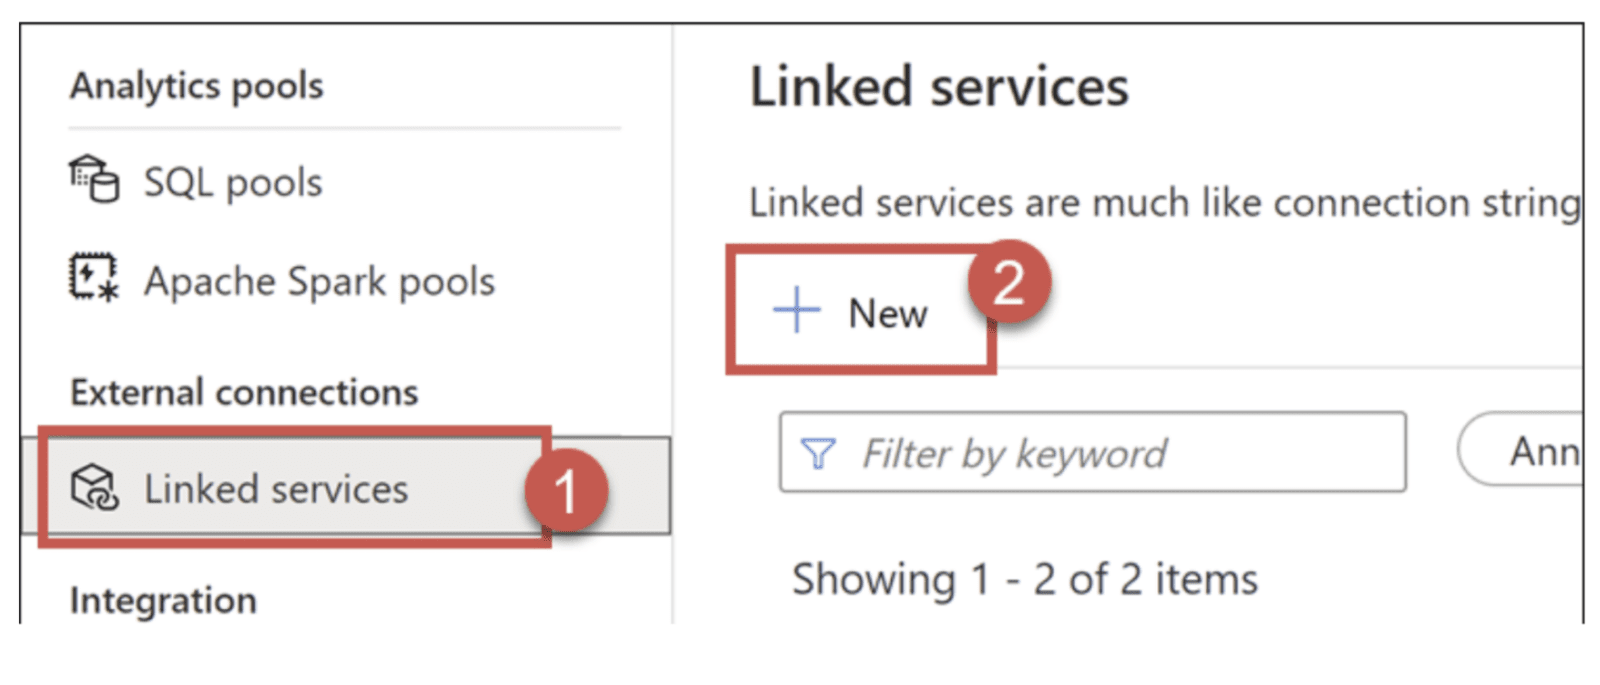
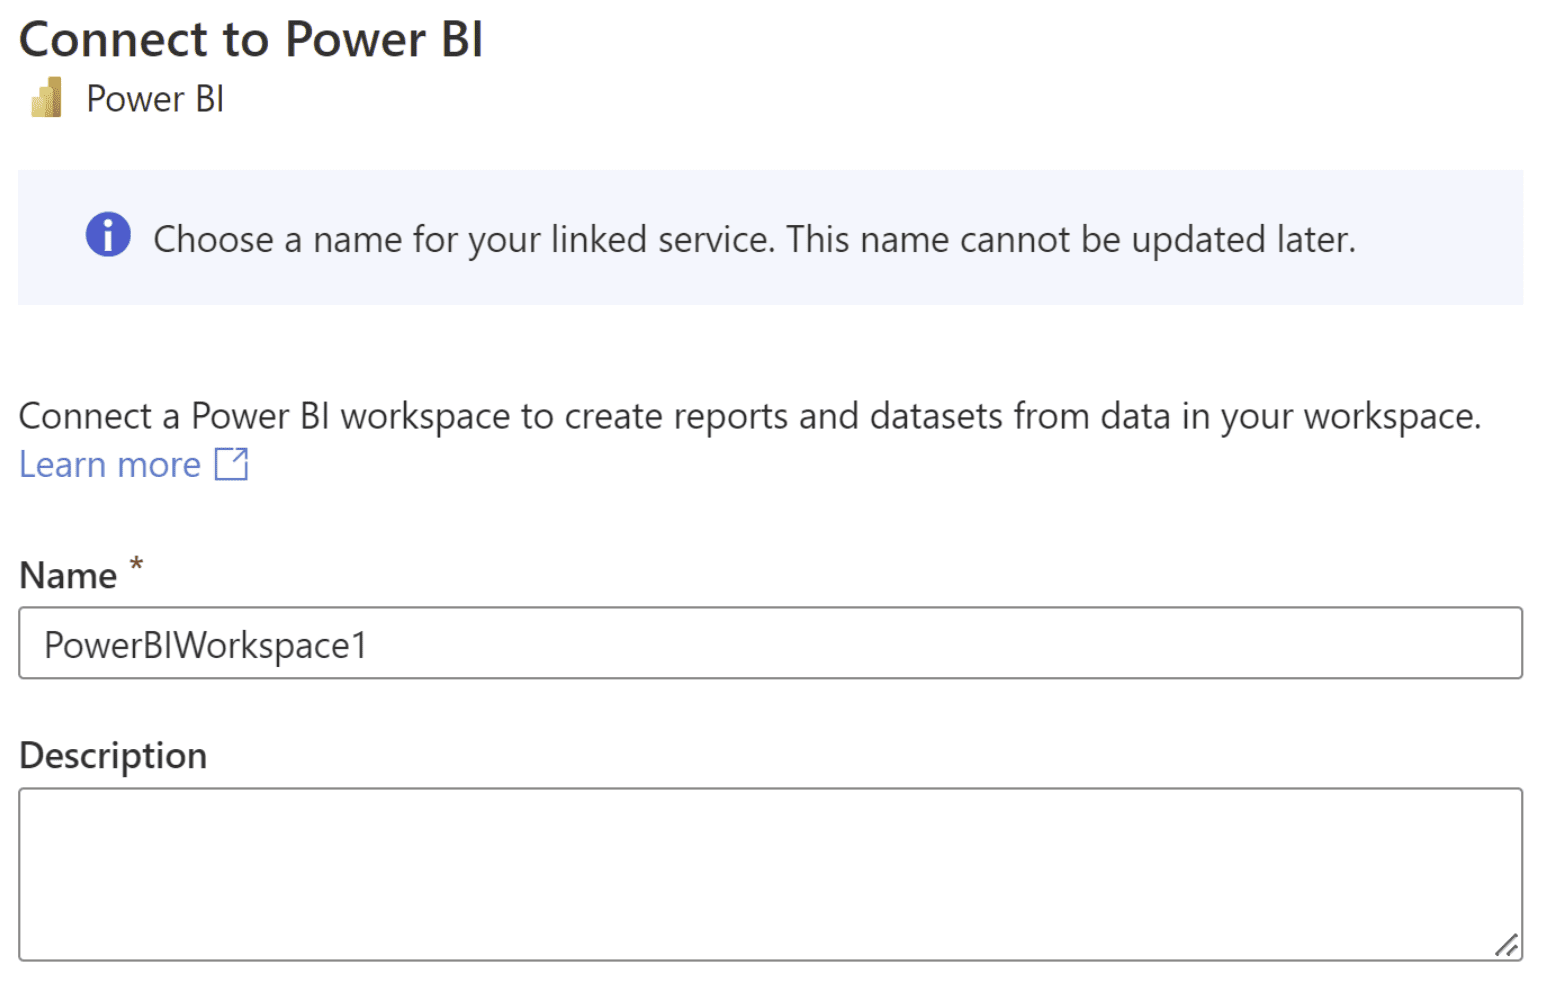
Select Power BI and configure the necessary workspace connection details.
Note: if the Azure tenant of the Synapse Workspace is different from the PBI tenant that you’re trying to connect to, you will not see any workspaces listed here.
Connecting the Data
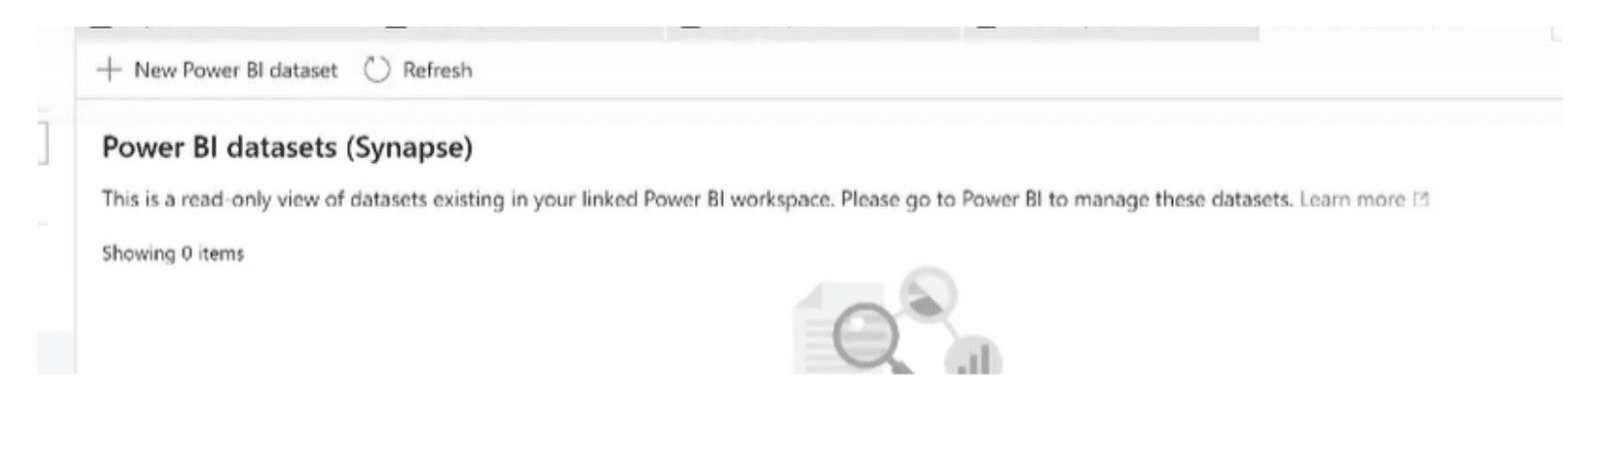
Now that the Synapse and Power BI workspaces are connected, you can interact between the two. In Synapse Studio, you can view existing datasets in the workspaces and connect directly to that data. When connecting in Synapse, you are viewing the dataset in a read-only state and cannot make changes to the existing dataset directly within Synapse Studio. A common practice would be to create a new Power BI dataset that is connected to data residing in the Synapse by using Azure SQL Server or the Azure Synapse connector as a data source for the PBIX.
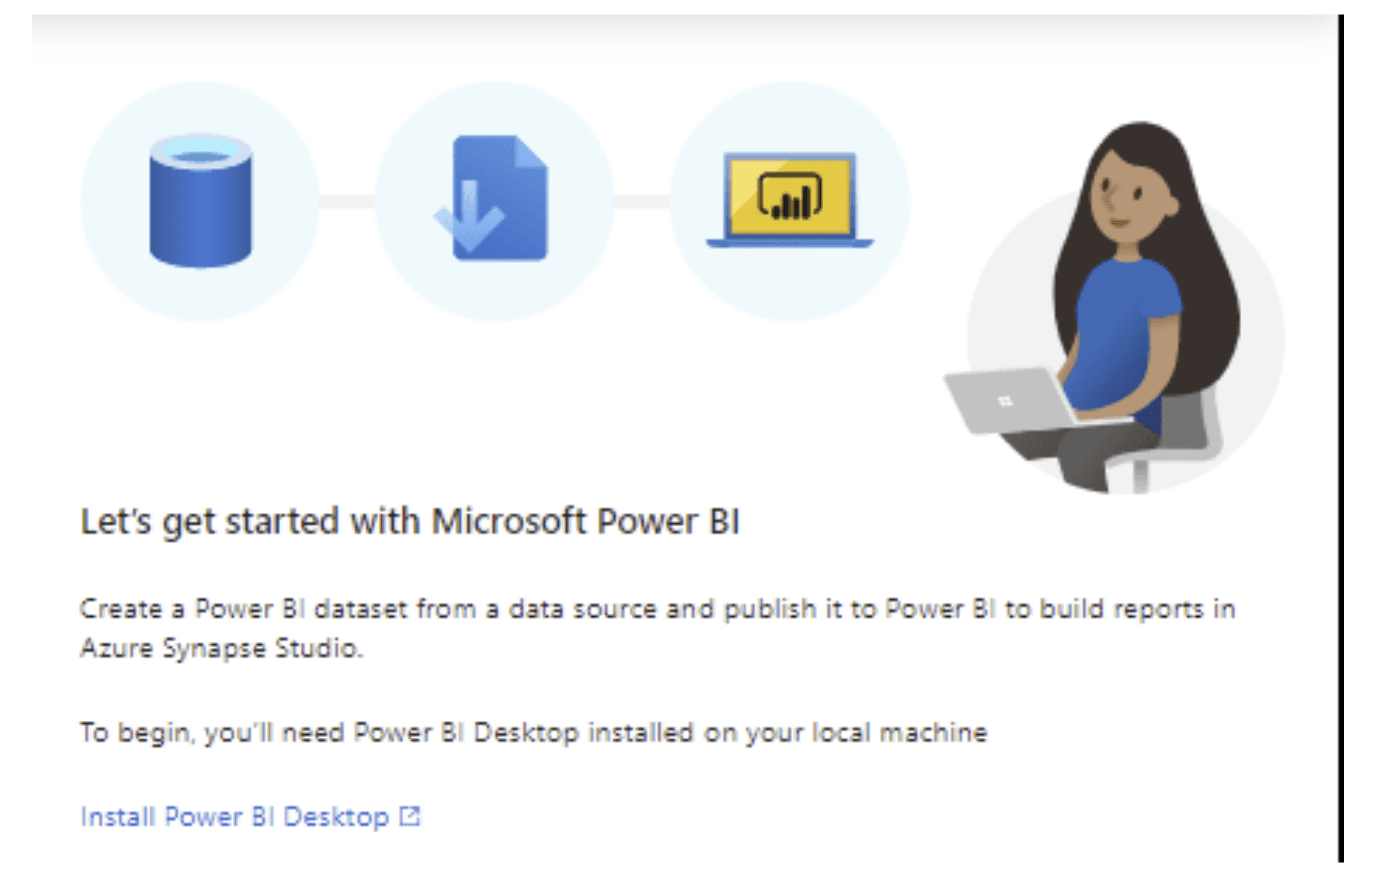
If you do not have an existing PBI dataset and need to create a new one, click “New Power BI Dataset” from the top ribbon.
You will be prompted to download PBI Desktop if you do not already have the program installed. Then, a blank PBIX opens in PBI Desktop. The PBIX is already connected to the data from the Synapse workspace. From there, design your dataset and publish it to the respective PBI workspace.
Note: You may need to refresh the Synapse Workspace or the PBI Workspace to see changes if you are iteratively creating new content between the two workspaces within the same session.
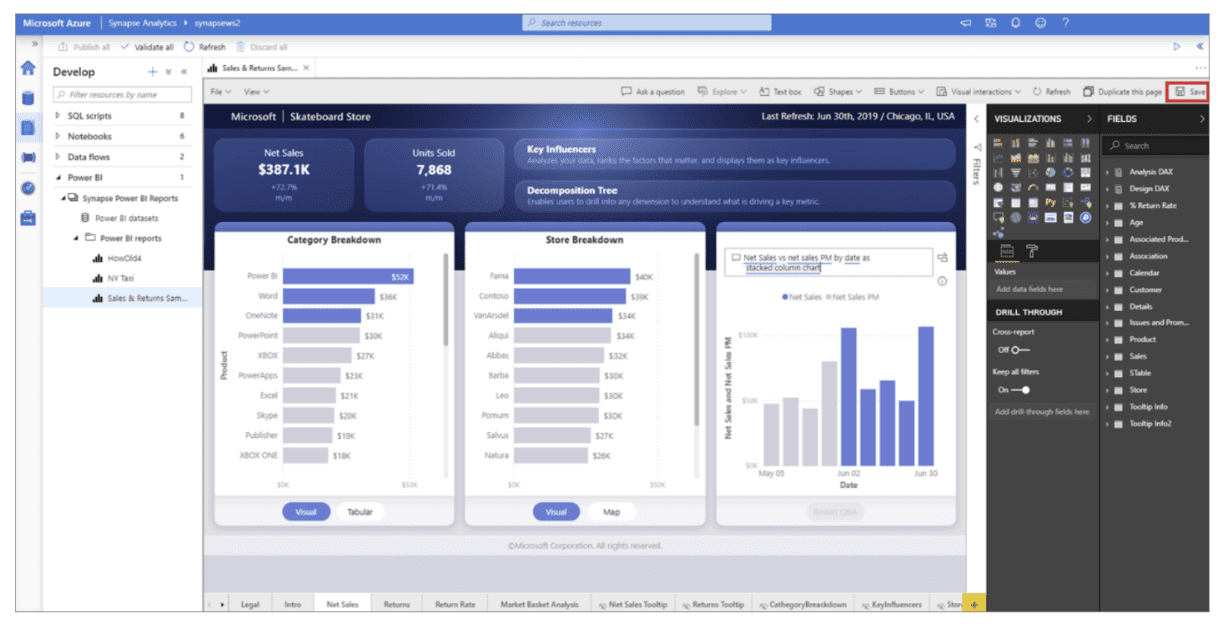
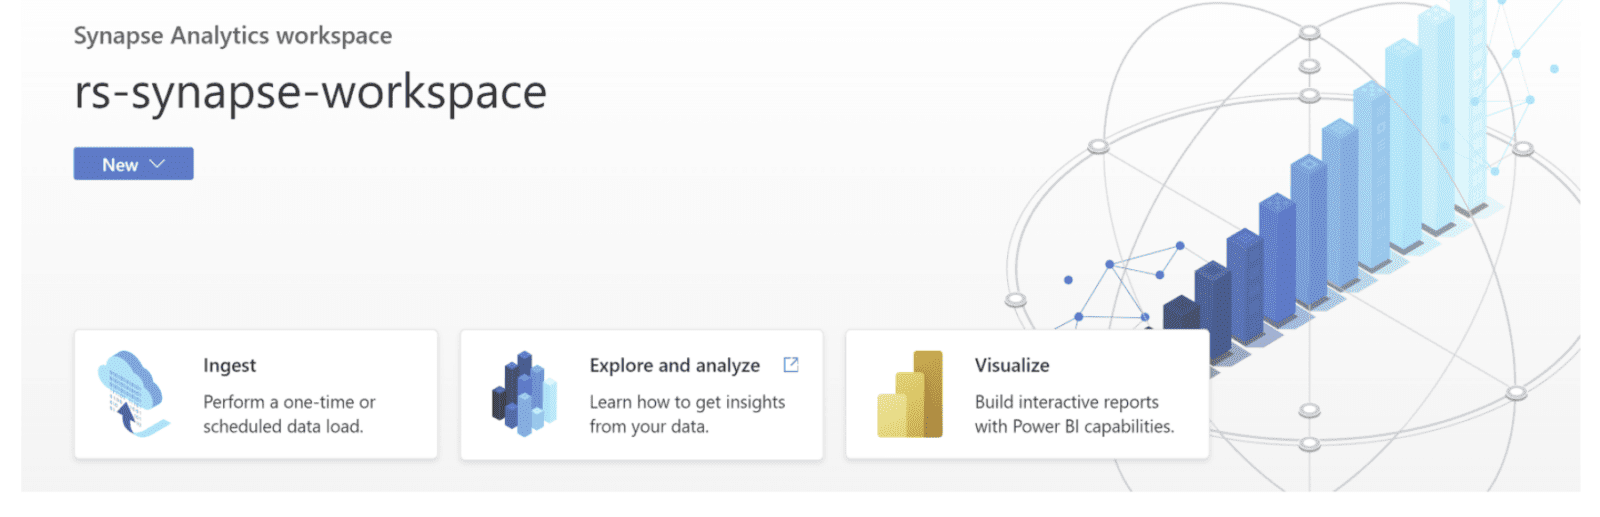
Navigate to the main Synapse Studio page. Here, we are going to build a report based on the data in Power BI. Click the Visualize button.
In Synapse Studio, enter the necessary Power BI connection details.
Building Reports
From here on, the integration is seamless. You can build reports using the same report designer experience as Power BI Service without ever needing to leave Synapse Studio. Drag and drop fields onto the canvas and design a truly sophisticated report from your data. There are a few differences from Power BI Service, for example, there are no dashboards within Synapse Studio, however, the basic design and customization functionalities exist.
To save your report, click File > Save As Copy to publish the changes to the Power BI Workspace. After clicking Save As, workspace users can see changes immediately. Something to bear in mind would be to remember to click “Update App” in Power BI Service to ensure the Apps are up to date if you are using Apps. Also note that if you are creating a new report and only click the Save button, the workspaces are not synchronized yet until you click File > Save As. Additionally, the Publish option in the top left does not publish to the Power BI workspace; the Publish option outputs the SQL scripts behind the queries.
Power BI Integration
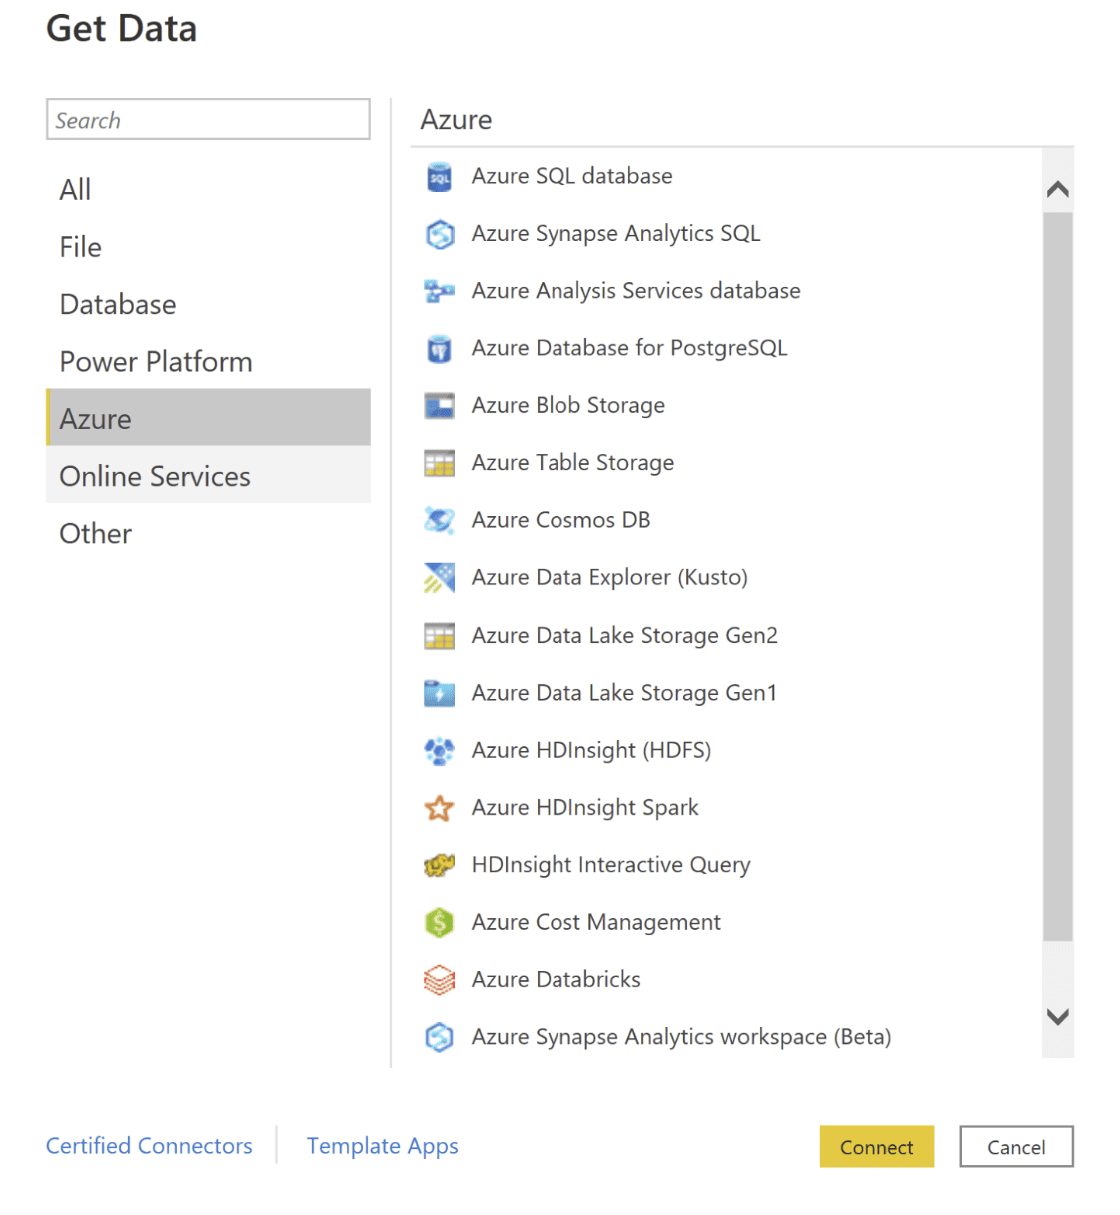
Within Power BI Desktop, there are three native connectors that allow you to create reports based off data in the Synapse workspace. To navigate to these connectors, go to the Home tab > Get Data > Azure section. The Azure Synapse Analytics SQL connector is used for SQL Databases in either dedicated or serverless SQL pools and Lake Databases in either Parquet or CSV format; further, the connector allows both Import and DirectQuery modes of connection. The Azure SQL Database connector also connects to SQL and Lake Databases and allows both Import and DirectQuery connections. These two connectors function in the same way since Synapse is the Data Warehouse equivalent of SQL Server; however, it is best to use the Azure Synapse Analytics SQL connector if your data resides in Synapse.
In July 2022, Microsoft announced the preview feature to connect to a Synapse workspace from Power Query. After connecting to Synapse, you will be able to load the entire tables and transform the data using the familiar Power Query experience. This option will make the integration between Synapse and Power BI much more straightforward and accessible. Further, the new connector broadens the horizons of Azure Synapse databases you can connect to: Apache Spark pools, data lakes, linked databases, or data imported by Azure Synapse Link.
After loading and transforming the data, Synapse directly integrates with Power BI to create powerful data visualizations. By using Power BI, you can bring the data to life by turning mere numbers into business insights. By creating interactive Power BI reports, developers make their data accessible to users of any skill level and enable them to make decisions to transform their businesses. Integration with Power BI workspaces also means integration with the full suite of Premium features, such as Paginated Reports, Deployment Pipelines, and Datamarts.
Further, PBI Service gives organizations a secure way to manage and distribute their content outside of the core data team. Users can grant permissions and define roles on the workspace, app, report, and dataset levels to control access and to uphold security standards. Apps provide a means to control who views the final state of the reports and when they view them.